
# Telemetry Guide
> 原文:[https://docs.gitlab.com/ee/development/telemetry/](https://docs.gitlab.com/ee/development/telemetry/)
* [Our tracking tools](#our-tracking-tools)
* [Snowplow JS (Frontend)](#snowplow-js-frontend)
* [Snowplow Ruby (Backend)](#snowplow-ruby-backend)
* [Usage Ping](#usage-ping)
* [Database import](#database-import)
* [Log system](#log-system)
* [What data can be tracked](#what-data-can-be-tracked)
* [Database counts](#database-counts)
* [Pageview events](#pageview-events)
* [UI Events](#ui-events)
* [CRUD or API events](#crud-or-api-events)
* [Event funnels](#event-funnels)
* [PostgreSQL data](#postgresql-data)
* [Logs](#logs)
* [External services](#external-services)
* [Telemetry systems overview](#telemetry-systems-overview)
* [GitLab Inc](#gitlab-inc)
* [Self-managed](#self-managed)
* [Differences between GitLab Inc and Self-managed](#differences-between-gitlab-inc-and-self-managed)
* [Snowflake data warehouse](#snowflake-data-warehouse)
* [Data sources](#data-sources)
# Telemetry Guide[](#telemetry-guide "Permalink")
在 GitLab,我们收集遥测信息,以帮助我们构建更好的 GitLab. 收集有关如何使用 GitLab 的数据,以更好地了解 GitLab 的哪些部分需要改进以及下一步要构建的功能. 遥测还可以帮助我们的团队更好地理解人们使用 GitLab 的原因,并且借助这一知识,我们能够做出更好的产品决策.
我们还鼓励用户启用跟踪功能,并且我们的跟踪方法完全透明,因此可以轻松理解和信任它. 通过启用跟踪,用户可以:
* 回馈更广泛的社区.
* 帮助 GitLab 改进产品.
本文档包含三个指南,概述了 GitLab 的遥测.
遥测指南:
1. [Our tracking tools](#our-tracking-tools)
2. [What data can be tracked](#what-data-can-be-tracked)
3. [Telemetry systems overview](#telemetry-systems-overview)
4. [Snowflake data warehouse](#snowflake-data-warehouse)
[Usage Ping Guide](usage_ping.html)
1. [What is Usage Ping](usage_ping.html#what-is-usage-ping)
2. [Usage Ping payload](usage_ping.html#usage-ping-payload)
3. [Disable Usage Ping](usage_ping.html#disable-usage-ping)
4. [Usage Ping request flow](usage_ping.html#usage-ping-request-flow)
5. [How Usage Ping works](usage_ping.html#how-usage-ping-works)
6. [Implementing Usage Ping](usage_ping.html#implementing-usage-ping)
7. [Developing and testing Usage Ping](usage_ping.html#developing-and-testing-usage-ping)
[Snowplow Guide](snowplow.html)
1. [What is Snowplow](snowplow.html#what-is-snowplow)
2. [Snowplow schema](snowplow.html#snowplow-schema)
3. [Enabling Snowplow](snowplow.html#enabling-snowplow)
4. [Snowplow request flow](snowplow.html#snowplow-request-flow)
5. [Implementing Snowplow JS (Frontend) tracking](snowplow.html#implementing-snowplow-js-frontend-tracking)
6. [Implementing Snowplow Ruby (Backend) tracking](snowplow.html#implementing-snowplow-ruby-backend-tracking)
7. [Developing and testing Snowplow](snowplow.html#developing-and-testing-snowplow)
更有用的链接:
* [Telemetry Direction](https://about.gitlab.com/direction/telemetry/)
* [Data Analysis Process](https://about.gitlab.com/handbook/business-ops/data-team/#data-analysis-process/)
* [Data for Product Managers](https://about.gitlab.com/handbook/business-ops/data-team/programs/data-for-product-managers/)
* [Data Infrastructure](https://about.gitlab.com/handbook/business-ops/data-team/platform/infrastructure/)
## Our tracking tools[](#our-tracking-tools "Permalink")
我们使用几种不同的技术来收集产品使用数据.
### Snowplow JS (Frontend)[](#snowplow-js-frontend "Permalink")
Snowplow 是企业级营销和产品分析平台,可帮助跟踪用户与我们的网站和应用程序互动的方式. [Snowplow JS](https://github.com/snowplow/snowplow/wiki/javascript-tracker)是客户端事件的前端跟踪器.
### Snowplow Ruby (Backend)[](#snowplow-ruby-backend "Permalink")
Snowplow 是企业级营销和产品分析平台,可帮助跟踪用户与我们的网站和应用程序互动的方式. [Snowplow Ruby](https://github.com/snowplow/snowplow/wiki/ruby-tracker)是服务器端事件的后端跟踪器.
### Usage Ping[](#usage-ping "Permalink")
用法 Ping 是 GitLab Inc 收集 GitLab 实例上的用法数据的一种方法. 用法 Ping 主要由实例数据库中不同表的行数组成. 通过逐月比较这些计数(或逐周比较),我们可以大致了解实例如何使用产品中的不同功能. 这些高级数据用于帮助我们的产品,支持和销售团队.
有关更多详细信息,请阅读《 [用法](usage_ping.html)说明》指南.
### Database import[](#database-import "Permalink")
数据库导入是将数据完全导入到 GitLab 的数据仓库中. 对于 GitLab.com,每 6 小时将 PostgreSQL 数据库加载到 Snowflake 数据仓库中. 有关更多详细信息,请参见[数据团队手册](https://about.gitlab.com/handbook/business-ops/data-team/platform/#extract-and-load) .
### Log system[](#log-system "Permalink")
系统日志是通过运行 GitLab Rails 应用程序生成的应用程序日志. 有关更多详细信息,请参阅[日志系统](../../administration/logs.html)和[日志记录基础结构](https://gitlab.com/gitlab-com/runbooks/tree/master/logging/doc#logging-infrastructure-overview) .
## What data can be tracked[](#what-data-can-be-tracked "Permalink")
我们不同的跟踪工具使我们能够跟踪不同类型的事件. 下面概述了事件类型和可以跟踪哪些数据的示例.
| 事件类型 | 扫雪机 JS(前端) | 扫雪机 Ruby(后端) | 使用情况 | 数据库导入 | 日志系统 |
| --- | --- | --- | --- | --- | --- |
| 数据库计数 | | | | | |
| 浏览量事件 | | | | | |
| UI 事件 | | | | | |
| CRUD 和 API 事件 | | | | | |
| 活动渠道 | | | | | |
| PostgreSQL 数据 | | | | | |
| Logs | | | | | |
| 外部服务 | | | | | |
### Database counts[](#database-counts "Permalink")
* 唯一用户创建的项目数
* Number of users logged in the past 28 day
数据库计数是实例数据库中不同表的行计数. 这些是经过过滤,分组或聚合的 SQL 计数查询,可提供高级使用情况数据. 可用表的完整列表可以在[structure.sql 中](https://gitlab.com/gitlab-org/gitlab/-/blob/master/db/structure.sql)找到.
### Pageview events[](#pageview-events "Permalink")
* 访问/ dashboard / groups 页面的会话数
### UI Events[](#ui-events "Permalink")
* 单击按钮或链接的会话数
* 关闭模式的会话数
UI 事件是浏览器中任何界面驱动的动作,包括点击数据.
### CRUD or API events[](#crud-or-api-events "Permalink")
* Git 推送次数
* GraphQL 查询数
* 对 Rails 操作或控制器的请求数
这些是后端事件,包括记录的创建,读取,更新,删除以及其他可能从界面中可用层以外的层触发的事件.
### Event funnels[](#event-funnels "Permalink")
* 依次执行操作 A,B 和 C 的会话数
* 从步骤 A 到步骤 B 的转化率
### PostgreSQL data[](#postgresql-data "Permalink")
这些是原始数据库记录,可使用 Sisense 等商业智能工具进行浏览. 可用表的完整列表可以在[structure.sql 中](https://gitlab.com/gitlab-org/gitlab/-/blob/master/db/structure.sql)找到.
### Logs[](#logs "Permalink")
这些是原始日志,例如[生产日志](../../administration/logs.html#production_jsonlog) , [API 日志](../../administration/logs.html#api_jsonlog)或[Sidekiq 日志](../../administration/logs.html#sidekiqlog) . 有关更多详细信息,请参见[日志记录基础结构概述](https://gitlab.com/gitlab-com/runbooks/tree/master/logging/doc#logging-infrastructure-overview) .
### External services[](#external-services "Permalink")
这些是 GitLab 实例与之交互的外部服务,例如[外部存储提供程序](../../administration/static_objects_external_storage.html)或[外部容器注册表](../../administration/packages/container_registry.html#use-an-external-container-registry-with-gitlab-as-an-auth-endpoint) . 这些服务必须能够将数据发送回 GitLab 实例,以便跟踪数据.
## Telemetry systems overview[](#telemetry-systems-overview "Permalink")
系统概述是一个简化的图,显示了 GitLab Inc 与自我管理实例之间的交互.
[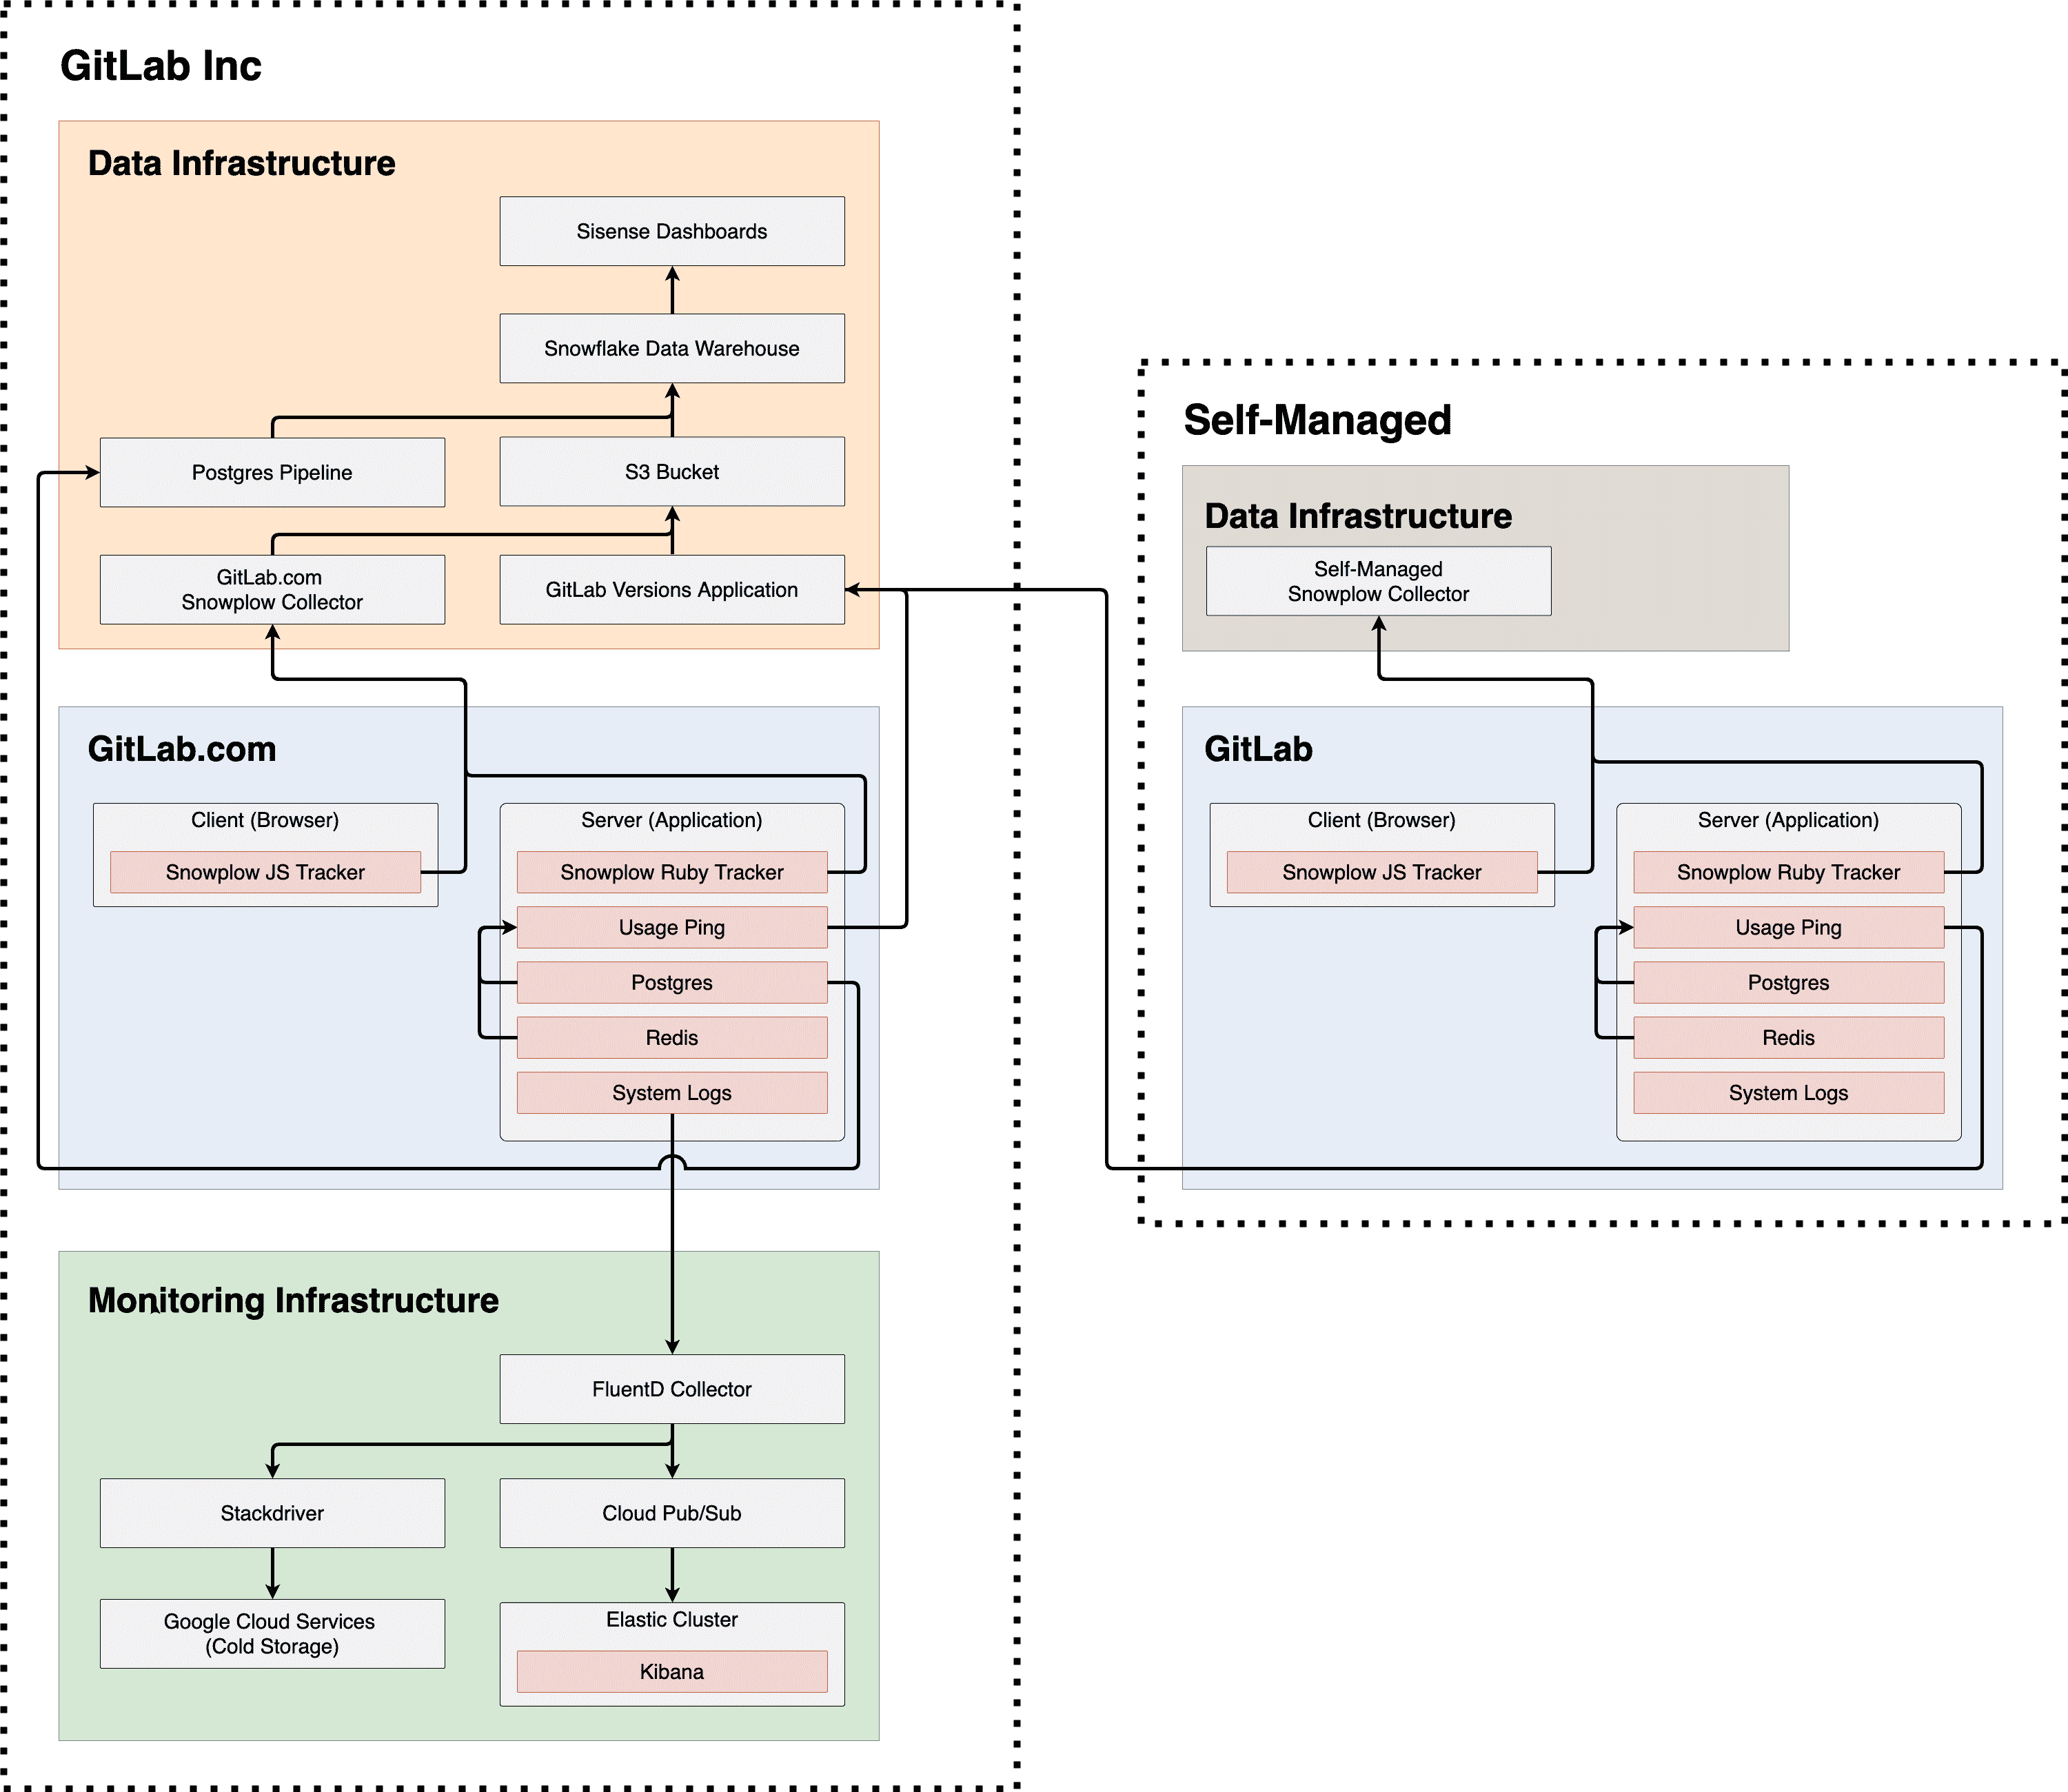](../img/telemetry_system_overview.png)
[Source file](https://app.diagrams.net/#G13DVpN-XnhWGz9tqReIj8pp1UE4ehk_EC)
### GitLab Inc[](#gitlab-inc "Permalink")
为了进行遥测,GitLab Inc 具有三个主要组件:
1. [数据基础架构](https://about.gitlab.com/handbook/business-ops/data-team/platform/infrastructure/) :包含我们数据团队管理的所有内容,包括用于可视化的 Sisense 仪表板,用于数据仓库的 Snowflake,传入数据源(例如 PostgreSQL Pipeline 和 S3 Bucket)以及最后是数据收集器[GitLab.com 的 Snowplow Collector](https://about.gitlab.com/handbook/engineering/infrastructure/library/snowplow/)和 GitLab 的 Versions 应用程序.
2. GitLab.com:这是生产的 GitLab 应用程序,由客户端和服务器组成. 在客户端或浏览器端,使用 Snowplow JS 跟踪器(前端)来跟踪客户端事件. 在服务器或应用程序端,使用 Snowplow Ruby 跟踪器(后端)来跟踪服务器端事件. 该服务器还包含使用率 Ping,它利用 PostgreSQL 数据库和 Redis 内存数据存储来报告使用率数据. 最后,服务器还包含通过运行 GitLab 应用程序生成的系统日志.
3. [监视基础结构](https://about.gitlab.com/handbook/engineering/monitoring/) :这是用于确保 GitLab.com 正常运行的基础结构. 系统日志从 GitLab.com 发送到我们的监视基础结构,并由 FluentD 收集器收集. 从 FluentD,日志可以通过 Stackdriver 发送到长期的 Google Cloud Services 冷存储,或者通过 Cloud Pub / Sub 发送到我们的 Elastic Cluster,可以使用 Kibana 进行实时浏览.
### Self-managed[](#self-managed "Permalink")
出于遥测目的,自我管理实例具有两个主要组成部分:
1. 数据基础结构:在自助式实例上,设置数据基础结构是可选的. 如果您想为自己管理的实例收集 Snowplow 跟踪事件,则可以设置自己的自我管理 Snowplow 收集器,并将 Snowplow 事件配置为指向自己的收集器.
2. GitLab:一个自我管理的 GitLab 实例包含与上述 GitLab.com 相同的所有组件.
### Differences between GitLab Inc and Self-managed[](#differences-between-gitlab-inc-and-self-managed "Permalink")
如橙色线所示,在 GitLab.com 上,Snowplow JS,Snowplow Ruby,Using Ping 和 PostgreSQL 数据库将所有流导入到 GitLab Inc 的数据基础结构中. 但是,在自我管理上,只有 Usage Ping 流入 GitLab Inc 的数据基础架构.
如绿线所示,在 GitLab.com 上的系统日志流进入 GitLab Inc 的监视基础结构. 在自我管理下,没有日志发送到 GitLab Inc 的监视基础结构.
GitLab.com 和自我管理之间的区别总结如下:
| Environment | 扫雪机 JS(前端) | 扫雪机 Ruby(后端) | 使用情况 | 数据库导入 | 日志系统 |
| --- | --- | --- | --- | --- | --- |
| GitLab.com | | | | | |
| Self-Managed | (1) | (1) | | | |
注意(1):Snowplow JS 和 Snowplow Ruby 在自我管理上可用,但是,Snowplow Collector 端点设置为 GitLab Inc 无法访问的自我管理 Snowplow Collector.
## Snowflake data warehouse[](#snowflake-data-warehouse "Permalink")
Snowflake 数据仓库是我们保存 GitLab Inc 所有数据的地方.
### Data sources[](#data-sources "Permalink")
Snowflake 和 Sisense 中有多个数据源可用,每个数据源代表沿转换管道的数据的不同视图.
| Source | Description | Access |
| --- | --- | --- |
| raw | 这些表是原始数据源 | Access via Snowflake |
| analytics_staging | 这些表几乎没有经过任何数据转换,这意味着它们基本上是原始数据源的克隆. | 通过雪花或 Sisense 访问 |
| analytics | 这些表通常经历了更多的数据转换. 它们通常以`_xf`以表示它们已转换的事实 | 通过雪花或 Sisense 访问 |
如果您是对原始数据感兴趣的产品经理,则可能会关注于`analytics`和`analytics_staging`源. 原始资源仅限于数据和基础架构团队. 有关更多信息,请参阅[产品经理数据:analytics_staging 和 analytics 之间有什么区别?](https://about.gitlab.com/handbook/business-ops/data-team/programs/data-for-product-managers/#whats-the-difference-between-analytics_staging-and-analytics)
- GitLab Docs
- Installation
- Requirements
- GitLab cloud native Helm Chart
- Install GitLab with Docker
- Installation from source
- Install GitLab on Microsoft Azure
- Installing GitLab on Google Cloud Platform
- Installing GitLab on Amazon Web Services (AWS)
- Analytics
- Code Review Analytics
- Productivity Analytics
- Value Stream Analytics
- Kubernetes clusters
- Adding and removing Kubernetes clusters
- Adding EKS clusters
- Adding GKE clusters
- Group-level Kubernetes clusters
- Instance-level Kubernetes clusters
- Canary Deployments
- Cluster Environments
- Deploy Boards
- GitLab Managed Apps
- Crossplane configuration
- Cluster management project (alpha)
- Kubernetes Logs
- Runbooks
- Serverless
- Deploying AWS Lambda function using GitLab CI/CD
- Securing your deployed applications
- Groups
- Contribution Analytics
- Custom group-level project templates
- Epics
- Manage epics
- Group Import/Export
- Insights
- Issues Analytics
- Iterations
- Public access
- SAML SSO for GitLab.com groups
- SCIM provisioning using SAML SSO for GitLab.com groups
- Subgroups
- Roadmap
- Projects
- GitLab Secure
- Security Configuration
- Container Scanning
- Dependency Scanning
- Dependency List
- Static Application Security Testing (SAST)
- Secret Detection
- Dynamic Application Security Testing (DAST)
- GitLab Security Dashboard
- Offline environments
- Standalone Vulnerability pages
- Security scanner integration
- Badges
- Bulk editing issues and merge requests at the project level
- Code Owners
- Compliance
- License Compliance
- Compliance Dashboard
- Create a project
- Description templates
- Deploy Keys
- Deploy Tokens
- File finder
- Project integrations
- Integrations
- Atlassian Bamboo CI Service
- Bugzilla Service
- Custom Issue Tracker service
- Discord Notifications service
- Enabling emails on push
- GitHub project integration
- Hangouts Chat service
- Atlassian HipChat
- Irker IRC Gateway
- GitLab Jira integration
- Mattermost Notifications Service
- Mattermost slash commands
- Microsoft Teams service
- Mock CI Service
- Prometheus integration
- Redmine Service
- Slack Notifications Service
- Slack slash commands
- GitLab Slack application
- Webhooks
- YouTrack Service
- Insights
- Issues
- Crosslinking Issues
- Design Management
- Confidential issues
- Due dates
- Issue Boards
- Issue Data and Actions
- Labels
- Managing issues
- Milestones
- Multiple Assignees for Issues
- Related issues
- Service Desk
- Sorting and ordering issue lists
- Issue weight
- Associate a Zoom meeting with an issue
- Merge requests
- Allow collaboration on merge requests across forks
- Merge Request Approvals
- Browser Performance Testing
- How to create a merge request
- Cherry-pick changes
- Code Quality
- Load Performance Testing
- Merge Request dependencies
- Fast-forward merge requests
- Merge when pipeline succeeds
- Merge request conflict resolution
- Reverting changes
- Reviewing and managing merge requests
- Squash and merge
- Merge requests versions
- Draft merge requests
- Members of a project
- Migrating projects to a GitLab instance
- Import your project from Bitbucket Cloud to GitLab
- Import your project from Bitbucket Server to GitLab
- Migrating from ClearCase
- Migrating from CVS
- Import your project from FogBugz to GitLab
- Gemnasium
- Import your project from GitHub to GitLab
- Project importing from GitLab.com to your private GitLab instance
- Import your project from Gitea to GitLab
- Import your Jira project issues to GitLab
- Migrating from Perforce Helix
- Import Phabricator tasks into a GitLab project
- Import multiple repositories by uploading a manifest file
- Import project from repo by URL
- Migrating from SVN to GitLab
- Migrating from TFVC to Git
- Push Options
- Releases
- Repository
- Branches
- Git Attributes
- File Locking
- Git file blame
- Git file history
- Repository mirroring
- Protected branches
- Protected tags
- Push Rules
- Reduce repository size
- Signing commits with GPG
- Syntax Highlighting
- GitLab Web Editor
- Web IDE
- Requirements Management
- Project settings
- Project import/export
- Project access tokens (Alpha)
- Share Projects with other Groups
- Snippets
- Static Site Editor
- Wiki
- Project operations
- Monitor metrics for your CI/CD environment
- Set up alerts for Prometheus metrics
- Embedding metric charts within GitLab-flavored Markdown
- Embedding Grafana charts
- Using the Metrics Dashboard
- Dashboard YAML properties
- Metrics dashboard settings
- Panel types for dashboards
- Using Variables
- Templating variables for metrics dashboards
- Prometheus Metrics library
- Monitoring AWS Resources
- Monitoring HAProxy
- Monitoring Kubernetes
- Monitoring NGINX
- Monitoring NGINX Ingress Controller
- Monitoring NGINX Ingress Controller with VTS metrics
- Alert Management
- Error Tracking
- Tracing
- Incident Management
- GitLab Status Page
- Feature Flags
- GitLab CI/CD
- GitLab CI/CD pipeline configuration reference
- GitLab CI/CD include examples
- Introduction to CI/CD with GitLab
- Getting started with GitLab CI/CD
- How to enable or disable GitLab CI/CD
- Using SSH keys with GitLab CI/CD
- Migrating from CircleCI
- Migrating from Jenkins
- Auto DevOps
- Getting started with Auto DevOps
- Requirements for Auto DevOps
- Customizing Auto DevOps
- Stages of Auto DevOps
- Upgrading PostgreSQL for Auto DevOps
- Cache dependencies in GitLab CI/CD
- GitLab ChatOps
- Cloud deployment
- Docker integration
- Building Docker images with GitLab CI/CD
- Using Docker images
- Building images with kaniko and GitLab CI/CD
- GitLab CI/CD environment variables
- Predefined environment variables reference
- Where variables can be used
- Deprecated GitLab CI/CD variables
- Environments and deployments
- Protected Environments
- GitLab CI/CD Examples
- Test a Clojure application with GitLab CI/CD
- Using Dpl as deployment tool
- Testing a Phoenix application with GitLab CI/CD
- End-to-end testing with GitLab CI/CD and WebdriverIO
- DevOps and Game Dev with GitLab CI/CD
- Deploy a Spring Boot application to Cloud Foundry with GitLab CI/CD
- How to deploy Maven projects to Artifactory with GitLab CI/CD
- Testing PHP projects
- Running Composer and NPM scripts with deployment via SCP in GitLab CI/CD
- Test and deploy Laravel applications with GitLab CI/CD and Envoy
- Test and deploy a Python application with GitLab CI/CD
- Test and deploy a Ruby application with GitLab CI/CD
- Test and deploy a Scala application to Heroku
- GitLab CI/CD for external repositories
- Using GitLab CI/CD with a Bitbucket Cloud repository
- Using GitLab CI/CD with a GitHub repository
- GitLab Pages
- GitLab Pages
- GitLab Pages domain names, URLs, and baseurls
- Create a GitLab Pages website from scratch
- Custom domains and SSL/TLS Certificates
- GitLab Pages integration with Let's Encrypt
- GitLab Pages Access Control
- Exploring GitLab Pages
- Incremental Rollouts with GitLab CI/CD
- Interactive Web Terminals
- Optimizing GitLab for large repositories
- Metrics Reports
- CI/CD pipelines
- Pipeline Architecture
- Directed Acyclic Graph
- Multi-project pipelines
- Parent-child pipelines
- Pipelines for Merge Requests
- Pipelines for Merged Results
- Merge Trains
- Job artifacts
- Pipeline schedules
- Pipeline settings
- Triggering pipelines through the API
- Review Apps
- Configuring GitLab Runners
- GitLab CI services examples
- Using MySQL
- Using PostgreSQL
- Using Redis
- Troubleshooting CI/CD
- GitLab Package Registry
- GitLab Container Registry
- Dependency Proxy
- GitLab Composer Repository
- GitLab Conan Repository
- GitLab Maven Repository
- GitLab NPM Registry
- GitLab NuGet Repository
- GitLab PyPi Repository
- API Docs
- API resources
- .gitignore API
- GitLab CI YMLs API
- Group and project access requests API
- Appearance API
- Applications API
- Audit Events API
- Avatar API
- Award Emoji API
- Project badges API
- Group badges API
- Branches API
- Broadcast Messages API
- Project clusters API
- Group clusters API
- Instance clusters API
- Commits API
- Container Registry API
- Custom Attributes API
- Dashboard annotations API
- Dependencies API
- Deploy Keys API
- Deployments API
- Discussions API
- Dockerfiles API
- Environments API
- Epics API
- Events
- Feature Flags API
- Feature flag user lists API
- Freeze Periods API
- Geo Nodes API
- Group Activity Analytics API
- Groups API
- Import API
- Issue Boards API
- Group Issue Boards API
- Issues API
- Epic Issues API
- Issues Statistics API
- Jobs API
- Keys API
- Labels API
- Group Labels API
- License
- Licenses API
- Issue links API
- Epic Links API
- Managed Licenses API
- Markdown API
- Group and project members API
- Merge request approvals API
- Merge requests API
- Project milestones API
- Group milestones API
- Namespaces API
- Notes API
- Notification settings API
- Packages API
- Pages domains API
- Pipeline schedules API
- Pipeline triggers API
- Pipelines API
- Project Aliases API
- Project import/export API
- Project repository storage moves API
- Project statistics API
- Project templates API
- Projects API
- Protected branches API
- Protected tags API
- Releases API
- Release links API
- Repositories API
- Repository files API
- Repository submodules API
- Resource label events API
- Resource milestone events API
- Resource weight events API
- Runners API
- SCIM API
- Search API
- Services API
- Application settings API
- Sidekiq Metrics API
- Snippets API
- Project snippets
- Application statistics API
- Suggest Changes API
- System hooks API
- Tags API
- Todos API
- Users API
- Project-level Variables API
- Group-level Variables API
- Version API
- Vulnerabilities API
- Vulnerability Findings API
- Wikis API
- GraphQL API
- Getting started with GitLab GraphQL API
- GraphQL API Resources
- API V3 to API V4
- Validate the .gitlab-ci.yml (API)
- User Docs
- Abuse reports
- User account
- Active sessions
- Deleting a User account
- Permissions
- Personal access tokens
- Profile preferences
- Threads
- GitLab and SSH keys
- GitLab integrations
- Git
- GitLab.com settings
- Infrastructure as code with Terraform and GitLab
- GitLab keyboard shortcuts
- GitLab Markdown
- AsciiDoc
- GitLab Notification Emails
- GitLab Quick Actions
- Autocomplete characters
- Reserved project and group names
- Search through GitLab
- Advanced Global Search
- Advanced Syntax Search
- Time Tracking
- GitLab To-Do List
- Administrator Docs
- Reference architectures
- Reference architecture: up to 1,000 users
- Reference architecture: up to 2,000 users
- Reference architecture: up to 3,000 users
- Reference architecture: up to 5,000 users
- Reference architecture: up to 10,000 users
- Reference architecture: up to 25,000 users
- Reference architecture: up to 50,000 users
- Troubleshooting a reference architecture set up
- Working with the bundled Consul service
- Configuring PostgreSQL for scaling
- Configuring GitLab application (Rails)
- Load Balancer for multi-node GitLab
- Configuring a Monitoring node for Scaling and High Availability
- NFS
- Working with the bundled PgBouncer service
- Configuring Redis for scaling
- Configuring Sidekiq
- Admin Area settings
- Continuous Integration and Deployment Admin settings
- Custom instance-level project templates
- Diff limits administration
- Enable and disable GitLab features deployed behind feature flags
- Geo nodes Admin Area
- GitLab Pages administration
- Health Check
- Job logs
- Labels administration
- Log system
- PlantUML & GitLab
- Repository checks
- Repository storage paths
- Repository storage types
- Account and limit settings
- Service templates
- System hooks
- Changing your time zone
- Uploads administration
- Abuse reports
- Activating and deactivating users
- Audit Events
- Blocking and unblocking users
- Broadcast Messages
- Elasticsearch integration
- Gitaly
- Gitaly Cluster
- Gitaly reference
- Monitoring GitLab
- Monitoring GitLab with Prometheus
- Performance Bar
- Usage statistics
- Object Storage
- Performing Operations in GitLab
- Cleaning up stale Redis sessions
- Fast lookup of authorized SSH keys in the database
- Filesystem Performance Benchmarking
- Moving repositories managed by GitLab
- Run multiple Sidekiq processes
- Sidekiq MemoryKiller
- Switching to Puma
- Understanding Unicorn and unicorn-worker-killer
- User lookup via OpenSSH's AuthorizedPrincipalsCommand
- GitLab Package Registry administration
- GitLab Container Registry administration
- Replication (Geo)
- Geo database replication
- Geo with external PostgreSQL instances
- Geo configuration
- Using a Geo Server
- Updating the Geo nodes
- Geo with Object storage
- Docker Registry for a secondary node
- Geo for multiple nodes
- Geo security review (Q&A)
- Location-aware Git remote URL with AWS Route53
- Tuning Geo
- Removing secondary Geo nodes
- Geo data types support
- Geo Frequently Asked Questions
- Geo Troubleshooting
- Geo validation tests
- Disaster Recovery (Geo)
- Disaster recovery for planned failover
- Bring a demoted primary node back online
- Automatic background verification
- Rake tasks
- Back up and restore GitLab
- Clean up
- Namespaces
- Maintenance Rake tasks
- Geo Rake Tasks
- GitHub import
- Import bare repositories
- Integrity check Rake task
- LDAP Rake tasks
- Listing repository directories
- Praefect Rake tasks
- Project import/export administration
- Repository storage Rake tasks
- Generate sample Prometheus data
- Uploads migrate Rake tasks
- Uploads sanitize Rake tasks
- User management
- Webhooks administration
- X.509 signatures
- Server hooks
- Static objects external storage
- Updating GitLab
- GitLab release and maintenance policy
- Security
- Password Storage
- Custom password length limits
- Restrict allowed SSH key technologies and minimum length
- Rate limits
- Webhooks and insecure internal web services
- Information exclusivity
- How to reset your root password
- How to unlock a locked user from the command line
- User File Uploads
- How we manage the TLS protocol CRIME vulnerability
- User email confirmation at sign-up
- Security of running jobs
- Proxying assets
- CI/CD Environment Variables
- Contributor and Development Docs
- Contribute to GitLab
- Community members & roles
- Implement design & UI elements
- Issues workflow
- Merge requests workflow
- Code Review Guidelines
- Style guides
- GitLab Architecture Overview
- CI/CD development documentation
- Database guides
- Database Review Guidelines
- Database Review Guidelines
- Migration Style Guide
- What requires downtime?
- Understanding EXPLAIN plans
- Rake tasks for developers
- Mass inserting Rails models
- GitLab Documentation guidelines
- Documentation Style Guide
- Documentation structure and template
- Documentation process
- Documentation site architecture
- Global navigation
- GitLab Docs monthly release process
- Telemetry Guide
- Usage Ping Guide
- Snowplow Guide
- Experiment Guide
- Feature flags in development of GitLab
- Feature flags process
- Developing with feature flags
- Feature flag controls
- Document features deployed behind feature flags
- Frontend Development Guidelines
- Accessibility & Readability
- Ajax
- Architecture
- Axios
- Design Patterns
- Frontend Development Process
- DropLab
- Emojis
- Filter
- Frontend FAQ
- GraphQL
- Icons and SVG Illustrations
- InputSetter
- Performance
- Principles
- Security
- Tooling
- Vuex
- Vue
- Geo (development)
- Geo self-service framework (alpha)
- Gitaly developers guide
- GitLab development style guides
- API style guide
- Go standards and style guidelines
- GraphQL API style guide
- Guidelines for shell commands in the GitLab codebase
- HTML style guide
- JavaScript style guide
- Migration Style Guide
- Newlines style guide
- Python Development Guidelines
- SCSS style guide
- Shell scripting standards and style guidelines
- Sidekiq debugging
- Sidekiq Style Guide
- SQL Query Guidelines
- Vue.js style guide
- Instrumenting Ruby code
- Testing standards and style guidelines
- Flaky tests
- Frontend testing standards and style guidelines
- GitLab tests in the Continuous Integration (CI) context
- Review Apps
- Smoke Tests
- Testing best practices
- Testing levels
- Testing Rails migrations at GitLab
- Testing Rake tasks
- End-to-end Testing
- Beginner's guide to writing end-to-end tests
- End-to-end testing Best Practices
- Dynamic Element Validation
- Flows in GitLab QA
- Page objects in GitLab QA
- Resource class in GitLab QA
- Style guide for writing end-to-end tests
- Testing with feature flags
- Translate GitLab to your language
- Internationalization for GitLab
- Translating GitLab
- Proofread Translations
- Merging translations from CrowdIn
- Value Stream Analytics development guide
- GitLab subscription
- Activate GitLab EE with a license