
在使用了Hystrix进行服务熔断降级之后,我们亟待于有一种方式可以查看Spring Cloud 微服务各个节点的哪些方法接口触发了熔断、请求成功数量、请求失败数量,包括断路器状态、服务请求频率等信息。我们获得了这些信息之后才能有效的进行服务的扩容、调整,从而更好地满足微服务系统的高并发以及高可用的要求!
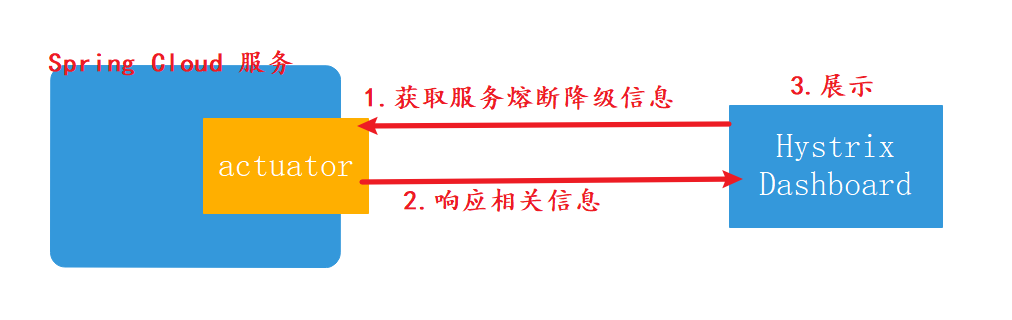
Hystrix 项目包含了一个DashBoard子模块可以帮助我们完成相关数据的获取以及展示工作。
## 一、新建Hystrix DashBoard监控web项目
新建一个Spring Boot项目,该项目集成Hystrix DashBoard之后可以完成服务熔断统计信息的展示。通过maven坐标引入Hystrix DashBoard
\* 新版本(笔者Spring CLoud H版)不要使用`spring-cloud-starter-hystrix-dashboard`,使用`spring-cloud-starter-netflix-hystrix-dashboard`
\* 不是web项目么?为什么没有`spring-boot-starter-web`?答:`spring-cloud-starter-netflix-hystrix-dashboard`已包含
~~~
<dependency>
<groupId>org.springframework.cloud</groupId>
<artifactId>spring-cloud-starter-netflix-hystrix-dashboard</artifactId>
</dependency>
<dependency>
<groupId>org.springframework.boot</groupId>
<artifactId>spring-boot-starter-actuator</artifactId>
</dependency>
~~~
application.yml,自定义一个不常用的项目启动端口
~~~
server:
port: 8772
~~~
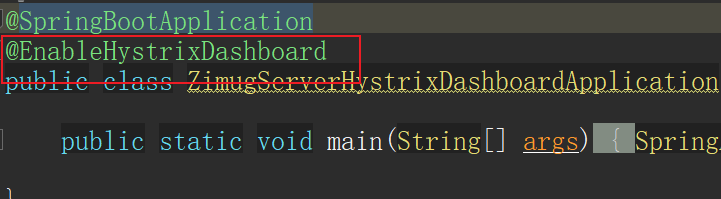
在项目启动入口类上面加上`@EnableHystrixDashboard`注解
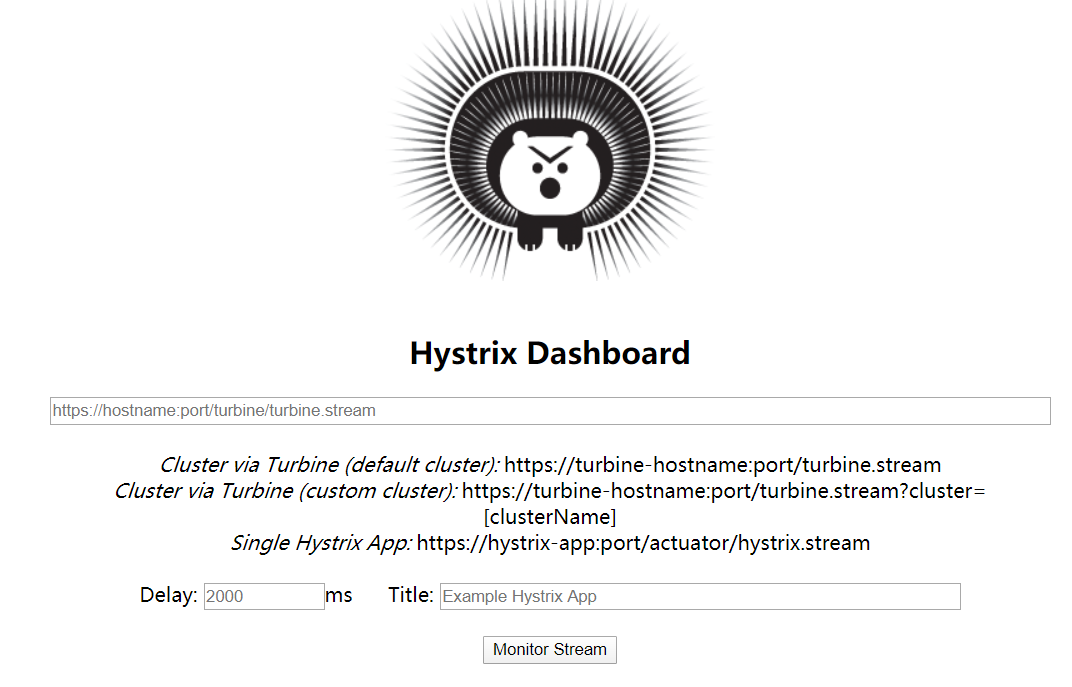
浏览器中访问:[http://localhost:8772/hystrix,](http://localhost:8772/hystrix%EF%BC%8C)若显示如下图所示,则表示Hystrix DashBoard监控服务正常运行,搭建成功。
## 二、被监控服务调整
上面一小节的操作,我们只是将Hystrix DashBoard监控服务完成。它将监控我们系统内的所有的微服务,为了保证能正确的从系统内的微服务获取服务熔断降级相关的信息。被监控的服务需要满足一些要求:
* 被监控的服务要正确的集成了Hystrix
* 所有被监控的微服务都要有actuator来暴露监控信息。
~~~
<dependency>
<groupId>org.springframework.boot</groupId>
<artifactId>spring-boot-starter-actuator</artifactId>
</dependency>
~~~
* 在actuator监控服务中暴露hystrix.stream监控端点。否则会有下图中的错误提示:

~~~
management:
endpoints:
web:
exposure:
include: refresh,health,hystrix.stream
~~~
## 三、访问监控服务web界面
本节为大家讲的这种Hystrix DashBoard搭建方式,一次只能监控一个服务。
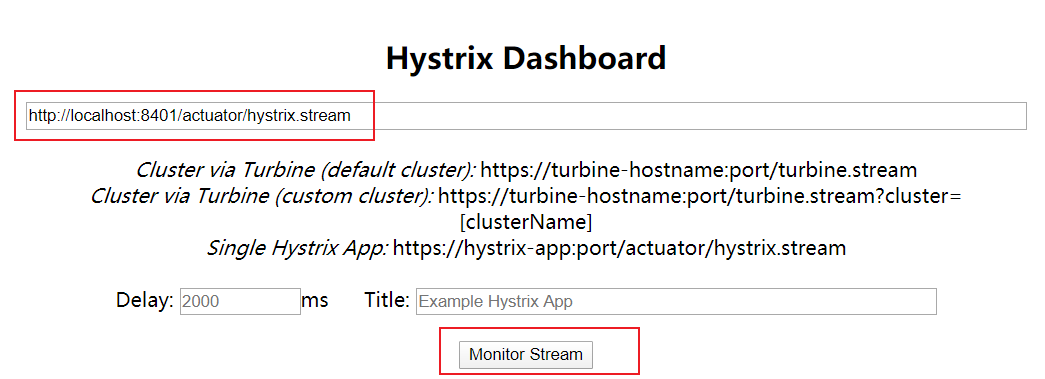
在地址栏输出某个微服务的actuator监控地址:[http://locahost:8401/actuator/hystrix.stream](http://locahost:8401/actuator/hystrix.stream),点击monitor Stream显示该服务的监控信息:
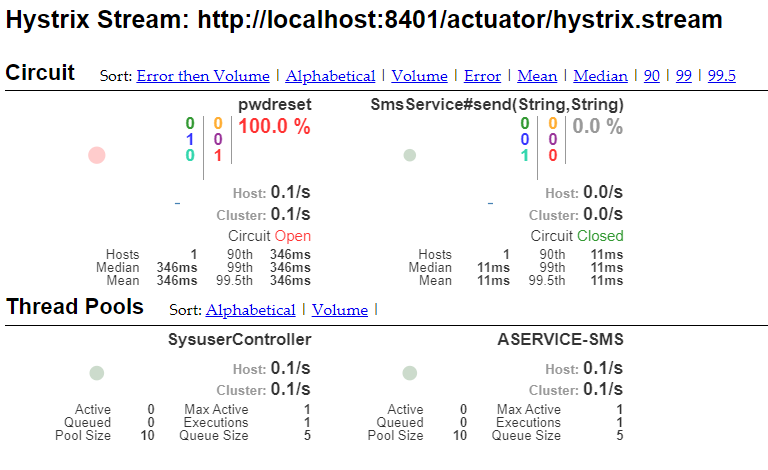
> 注意:查看hystrix监控之前,一定要访问一次API,否则一直Loading。
* **实心圆颜色变化**:颜色的变化代表了实例的健康程度,它的健康程度从 绿色 > 黄色 > 橙色 > 红色 递减;
* **实心圆大小变化**:流量越大实心圆就越大,
所以通过该实心圆的展示,就可以在大量实例中快速的发现**故障实例和高压力实例**。
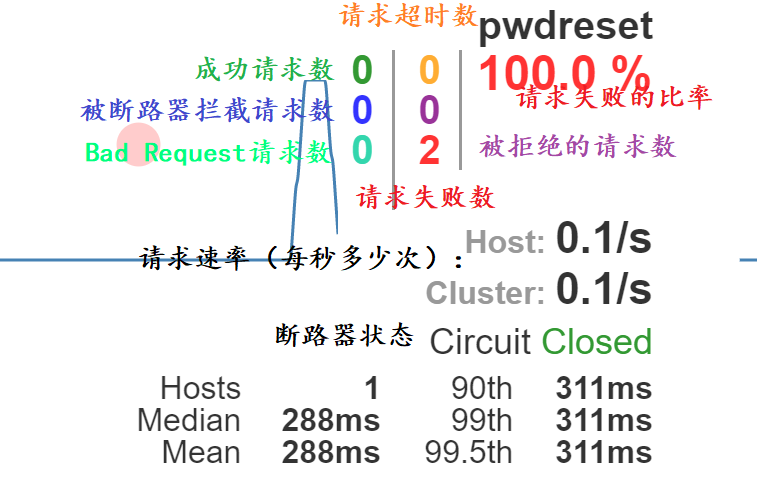
#### 详细图解
- 文档简介
- 模块与代码分支说明
- dongbb-cloud项目核心架构
- 微服务架构进化论
- SpringBoot与Cloud选型兼容
- Spring Cloud组件的选型
- 单体应用拆分微服务
- 单体应用与微服务对比
- 微服务设计拆分原则
- 新建父工程及子模块框架
- 通用微服务初始化模块构建
- 持久层模块单独拆分
- 拆分rbac权限管理微服务
- Hello-microservice
- 构建eureka服务注册中心
- 向服务注册中心注册服务
- 第一个微服务调用
- 远程服务调用
- HttpClient远程服务调用
- RestTemplate远程服务调用
- RestTemplate多实例负载均衡
- Ribbon调用流程源码解析
- Ribbon负载均衡策略源码解析
- Ribbon重试机制与饥饿加载
- Ribbon自定义负载均衡策略
- Feign与OpenFeign
- Feign设计原理源码解析
- Feign请求压缩与超时等配置
- 服务注册与发现
- 白话服务注册与发现
- DiscoveryClient服务发现
- Eureka集群环境构建(linux)
- Eureka集群多网卡环境ip设置
- Eureka集群服务注册与安全认证
- Eureka自我保护与健康检查
- 主流服务注册中心对比(含nacos)
- zookeeper概念及功能简介
- zookeeper-linux集群安装
- zookeeper服务注册与发现
- consul概念及功能介绍
- consul-linux集群安装
- consul服务注册与发现
- 通用-auatator导致401问题
- 分布式配置中心-apollo
- 服务配置中心概念及使用场景
- apollo概念功能简介
- apollo架构详解
- apollo分布式部署之Portal
- apollo分布式部署之环境区分
- apollo项目权限管理实战
- apollo-java客户端基础
- apollo与SpringCloud服务集成
- apollo实例配置热更新
- apollo命名空间与集群
- apollo灰度发布(日志热更新为例)
- SpringCloudConfig配置中心
- config-git配置文件仓库
- config配置中心搭建与测试
- config客户端基础
- config配置安全认证
- config客户端配置刷新
- config配置中心高可用
- BUS消息总线
- bus消息总线简介
- docker安装rabbitMQ
- 基于rabbitMQ的消息总线
- bus实现批量配置刷新
- alibaba-nacos
- nacos介绍与单机部署
- nacos集群部署方式(linux)
- nacos服务注册与发现
- nacos服务注册中心详解
- nacos客户端配置加载
- nacos客户端配置刷新
- nacos服务配置隔离与共享
- nacos配置Beta发布
- 服务熔断降级hystrix
- 服务降级&熔断&限流
- Hystrix集成并实现服务熔断
- Jemter模拟触发服务熔断
- Hystrix服务降级fallback
- Hystrix结合Feign服务降级
- 远程服务调用异常传递的问题
- Hystrix-Feign异常拦截与处理
- Hystrix-DashBoard单服务监控
- Hystrix-dashboard集群监控
- 分布式系统流量卫兵sentinel
- sentinel简介与安装
- 客户端集成与实时监控
- 实战流控规则-QPS限流
- 实战流控规则-线程数限流
- 实战流控规则-关联限流
- 实战流控规则-链路限流
- 实战流控效果-WarmUp
- 实战流控效果-匀速排队
- BlockException处理
- 实战熔断降级-RT
- 实战熔断降级-异常数与比例
- DegradeException处理
- 注解与异常的归纳总结
- Feign降级及异常传递拦截
- 动态规则nacos集中存储
- 热点参数限流
- 系统自适应限流
- 微服务网关-GateWay
- 还有必要学习Zuul么?
- 简介与非阻塞异步IO模型
- GateWay概念与流程
- 新建一个GateWay项目
- 通用Predicate的使用
- 自定义PredicateFactory
- 编码方式构建静态路由
- Filter过滤器介绍与使用
- 自定义过滤器Filter
- 网关请求转发负载均衡
- 结合nacos实现动态路由配置
- 整合Sentinel实现资源限流
- 跨域访问配置
- 网关层面全局异常处理
- 微服务网关安全认证-JWT篇
- Gateway-JWT认证鉴权流程
- 登录认证JWT令牌颁发
- 全局过滤器实现JWT鉴权
- 微服务自身内部的权限管理