
[TOC]
本节我们将写一个程序,来接收Prometheus发送的告警,并将告警打印出来。
首先,我们安装好Prometheus、NodeExporter。Prometheus的配置prometheus.yml如下:
```
global:
scrape_interval: 15s
evaluation_interval: 15s
rule_files:
- "/usr/local/prometheus/rule_files/node.yml"
scrape_configs:
- job_name: 'node-exporter'
static_configs:
- targets: ['192.168.2.101:9100']
labels:
IP: '192.168.2.101'
alerting:
alertmanagers:
- static_configs:
- targets: [ '192.168.2.101:19093' ]
```
告警规则文件`node.yml`内容如下:
```
groups:
- name: Node
rules:
- alert: NodeCpuPressure
expr: 100 * (1 - avg(irate(node_cpu_seconds_total{mode="idle"}[2m])) by(IP)) > 80
for: 2m
annotations:
summary: "NodeCpuPressure, IP: {{$labels.IP}}, Value: {{$value}}%, Threshold: 80%"
```
在上面的prometheus.yml中,我们配置的alertmanager的地址为`192.168.2.101:19093`,这个地址就是接下来我们要启动的自已的程序,用来接收prometheus的告警信息并打印出来。
在主机上的某个目录下创建文件alertmanager.go,文件内容见本文附录,然后执行命令`go run alertmanager.go`将程序跑起来。
接着,我们启动Prometheus与NodeExporter。
然后,我们拉高主机CPU的使用率,不一会,我们便可以在Prometheus的Alert页面看到一个告警处理Pending状态
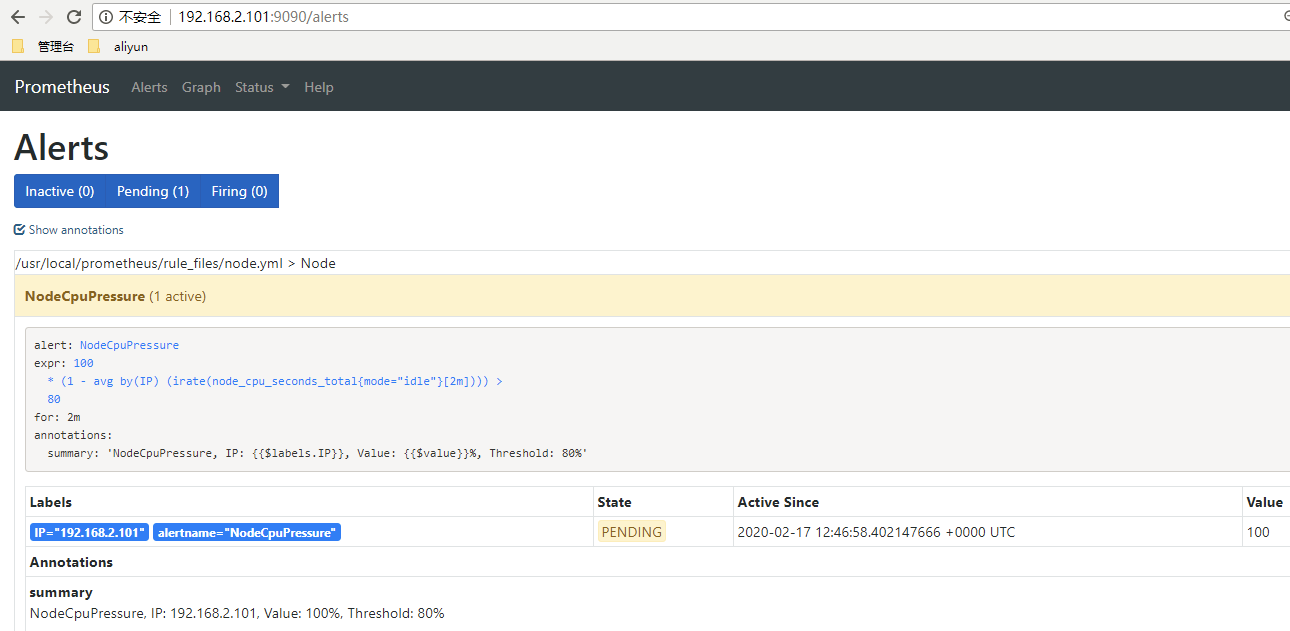
再等一会,等告警Firing之后,我们自已的程序会接收到该告警并打印出来:可以发现,startsAt就是上面截图中的Active Since的时间,也就是Alert变成Pending的时间。endsAt刚好是startAt加了三分钟(这个暂时不清楚为什么是三分钟)。
```
$ go run alertmanager.go
2020-02-17 20:48:58.411459407 +0800 CST m=+191.432028937
[{"labels":{"IP":"192.168.2.101","alertname":"NodeCpuPressure"},"annotations":{"summary":"NodeCpuPressure, IP: 192.168.2.101, Value: 100%, Threshold: 80%"},"startsAt":"2020-02-17T20:48:58.402147666+08:00","endsAt":"2020-02-17T20:51:58.402147666+08:00","generatorURL":"http://peng01:9090/graph?g0.expr=100+%2A+%281+-+avg+by%28IP%29+%28irate%28node_cpu_seconds_total%7Bmode%3D%22idle%22%7D%5B2m%5D%29%29%29+%3E+80\u0026g0.tab=1"}]
```
让CPU一直保持在80%以上,我们会发现Prometheus会持续地向AlertManager发送Alert。我们发现,发送的时间间隔为75秒(为什么是75秒还不清楚,很有可能是evaluation_interval的五倍),startsAt一直没变,而endsAt一直在增加,增加的时间为Prometheus发送该告警的时间再加3m。
```
2020-02-17 20:48:58.411459407 +0800 CST m=+191.432028937
[{"labels":{"IP":"192.168.2.101","alertname":"NodeCpuPressure"},"annotations":{"summary":"NodeCpuPressure, IP: 192.168.2.101, Value: 100%, Threshold: 80%"},"startsAt":"2020-02-17T20:48:58.402147666+08:00","endsAt":"2020-02-17T20:51:58.402147666+08:00","generatorURL":"http://peng01:9090/graph?g0.expr=100+%2A+%281+-+avg+by%28IP%29+%28irate%28node_cpu_seconds_total%7Bmode%3D%22idle%22%7D%5B2m%5D%29%29%29+%3E+80\u0026g0.tab=1"}]
2020-02-17 20:50:13.405880837 +0800 CST m=+266.426450346
[{"labels":{"IP":"192.168.2.101","alertname":"NodeCpuPressure"},"annotations":{"summary":"NodeCpuPressure, IP: 192.168.2.101, Value: 100%, Threshold: 80%"},"startsAt":"2020-02-17T20:48:58.402147666+08:00","endsAt":"2020-02-17T20:53:13.402147666+08:00","generatorURL":"http://peng01:9090/graph?g0.expr=100+%2A+%281+-+avg+by%28IP%29+%28irate%28node_cpu_seconds_total%7Bmode%3D%22idle%22%7D%5B2m%5D%29%29%29+%3E+80\u0026g0.tab=1"}]
2020-02-17 20:51:28.405287147 +0800 CST m=+341.425856660
[{"labels":{"IP":"192.168.2.101","alertname":"NodeCpuPressure"},"annotations":{"summary":"NodeCpuPressure, IP: 192.168.2.101, Value: 100%, Threshold: 80%"},"startsAt":"2020-02-17T20:48:58.402147666+08:00","endsAt":"2020-02-17T20:54:28.402147666+08:00","generatorURL":"http://peng01:9090/graph?g0.expr=100+%2A+%281+-+avg+by%28IP%29+%28irate%28node_cpu_seconds_total%7Bmode%3D%22idle%22%7D%5B2m%5D%29%29%29+%3E+80\u0026g0.tab=1"}]
2020-02-17 20:52:43.40958641 +0800 CST m=+416.430155922
[{"labels":{"IP":"192.168.2.101","alertname":"NodeCpuPressure"},"annotations":{"summary":"NodeCpuPressure, IP: 192.168.2.101, Value: 100%, Threshold: 80%"},"startsAt":"2020-02-17T20:48:58.402147666+08:00","endsAt":"2020-02-17T20:55:43.402147666+08:00","generatorURL":"http://peng01:9090/graph?g0.expr=100+%2A+%281+-+avg+by%28IP%29+%28irate%28node_cpu_seconds_total%7Bmode%3D%22idle%22%7D%5B2m%5D%29%29%29+%3E+80\u0026g0.tab=1"}]
2020-02-17 20:53:58.405264448 +0800 CST m=+491.425833979
[{"labels":{"IP":"192.168.2.101","alertname":"NodeCpuPressure"},"annotations":{"summary":"NodeCpuPressure, IP: 192.168.2.101, Value: 100%, Threshold: 80%"},"startsAt":"2020-02-17T20:48:58.402147666+08:00","endsAt":"2020-02-17T20:56:58.402147666+08:00","generatorURL":"http://peng01:9090/graph?g0.expr=100+%2A+%281+-+avg+by%28IP%29+%28irate%28node_cpu_seconds_total%7Bmode%3D%22idle%22%7D%5B2m%5D%29%29%29+%3E+80\u0026g0.tab=1"}]
2020-02-17 20:55:13.406017704 +0800 CST m=+22.465382727
[{"labels":{"IP":"192.168.2.101","alertname":"NodeCpuPressure"},"annotations":{"summary":"NodeCpuPressure, IP: 192.168.2.101, Value: 100%, Threshold: 80%"},"startsAt":"2020-02-17T20:48:58.402147666+08:00","endsAt":"2020-02-17T20:58:13.402147666+08:00","generatorURL":"http://peng01:9090/graph?g0.expr=100+%2A+%281+-+avg+by%28IP%29+%28irate%28node_cpu_seconds_total%7Bmode%3D%22idle%22%7D%5B2m%5D%29%29%29+%3E+80\u0026g0.tab=1"}]
2020-02-17 20:56:28.405989243 +0800 CST m=+97.465354315
[{"labels":{"IP":"192.168.2.101","alertname":"NodeCpuPressure"},"annotations":{"summary":"NodeCpuPressure, IP: 192.168.2.101, Value: 100%, Threshold: 80%"},"startsAt":"2020-02-17T20:48:58.402147666+08:00","endsAt":"2020-02-17T20:59:28.402147666+08:00","generatorURL":"http://peng01:9090/graph?g0.expr=100+%2A+%281+-+avg+by%28IP%29+%28irate%28node_cpu_seconds_total%7Bmode%3D%22idle%22%7D%5B2m%5D%29%29%29+%3E+80\u0026g0.tab=1"}]
```
接着,我们把CPU降到80%以下(时间大概在20:56:28到20:56:58之间)。我们会发现,20:56:28时发送的告警(上面的最后一条),其endsAt的时间为20:59:28,说明发送该条告警时,CPU还处于80%以上。而过了30秒后,Promethus又发送了一条告警(下面第一条),这一次没有等到75秒,是因为发送该条告警时CPU已经低于80%了。
这里我们就有两个疑问了:(1)我们如何判断发送下面第一条告警时CPU已经低于80%了呢?(2)下面第一条告警中,CPU的值显示的是81.76666666656578%呀?
其实原因是很简单:我们配置了evaluation_interval的值为15秒,Prometheus在上面最后一条告警(20:56:28)后,在20:56:43和20:56:58都会做一次Evaluation,在20:56:43这一次计算出来的CPU的值为81.76666666656578%,由于上一条告警还没有过75秒,所以不发送。在20:56:58时该计算出来的CPU已经小于80%,相当于告警已经解除,于是Prometheus会立即发送一条告警出去,表明告警已解除。也就是说,下面第一条告警其实是一条“解除告警”,为什么呢?因为endsAt的时间就是发送该条告警的时间,当AlertManager接收到以后,发现这个时间已经是一个过去的时间了,也就是说,这条告警已经结束了。既然已经通过endsAt标识该告警已经过时了,那么CPU的值也就不重要了,不过Prometheus用了“解除告警”的上一次计算出来的值还有让人有点容易混淆。
```
2020-02-17 20:56:58.405968564 +0800 CST m=+127.465333664
[{"labels":{"IP":"192.168.2.101","alertname":"NodeCpuPressure"},"annotations":{"summary":"NodeCpuPressure, IP: 192.168.2.101, Value: 81.76666666656578%, Threshold: 80%"},"startsAt":"2020-02-17T20:48:58.402147666+08:00","endsAt":"2020-02-17T20:56:58.402147666+08:00","generatorURL":"http://peng01:9090/graph?g0.expr=100+%2A+%281+-+avg+by%28IP%29+%28irate%28node_cpu_seconds_total%7Bmode%3D%22idle%22%7D%5B2m%5D%29%29%29+%3E+80\u0026g0.tab=1"}]
2020-02-17 20:58:13.408337229 +0800 CST m=+202.467702513
[{"labels":{"IP":"192.168.2.101","alertname":"NodeCpuPressure"},"annotations":{"summary":"NodeCpuPressure, IP: 192.168.2.101, Value: 81.76666666656578%, Threshold: 80%"},"startsAt":"2020-02-17T20:48:58.402147666+08:00","endsAt":"2020-02-17T20:56:58.402147666+08:00","generatorURL":"http://peng01:9090/graph?g0.expr=100+%2A+%281+-+avg+by%28IP%29+%28irate%28node_cpu_seconds_total%7Bmode%3D%22idle%22%7D%5B2m%5D%29%29%29+%3E+80\u0026g0.tab=1"}]
2020-02-17 20:59:28.406675061 +0800 CST m=+277.466040229
[{"labels":{"IP":"192.168.2.101","alertname":"NodeCpuPressure"},"annotations":{"summary":"NodeCpuPressure, IP: 192.168.2.101, Value: 81.76666666656578%, Threshold: 80%"},"startsAt":"2020-02-17T20:48:58.402147666+08:00","endsAt":"2020-02-17T20:56:58.402147666+08:00","generatorURL":"http://peng01:9090/graph?g0.expr=100+%2A+%281+-+avg+by%28IP%29+%28irate%28node_cpu_seconds_total%7Bmode%3D%22idle%22%7D%5B2m%5D%29%29%29+%3E+80\u0026g0.tab=1"}]
2020-02-17 21:00:43.40653634 +0800 CST m=+352.465901514
[{"labels":{"IP":"192.168.2.101","alertname":"NodeCpuPressure"},"annotations":{"summary":"NodeCpuPressure, IP: 192.168.2.101, Value: 81.76666666656578%, Threshold: 80%"},"startsAt":"2020-02-17T20:48:58.402147666+08:00","endsAt":"2020-02-17T20:56:58.402147666+08:00","generatorURL":"http://peng01:9090/graph?g0.expr=100+%2A+%281+-+avg+by%28IP%29+%28irate%28node_cpu_seconds_total%7Bmode%3D%22idle%22%7D%5B2m%5D%29%29%29+%3E+80\u0026g0.tab=1"}]
2020-02-17 21:01:58.405259946 +0800 CST m=+427.464625058
[{"labels":{"IP":"192.168.2.101","alertname":"NodeCpuPressure"},"annotations":{"summary":"NodeCpuPressure, IP: 192.168.2.101, Value: 81.76666666656578%, Threshold: 80%"},"startsAt":"2020-02-17T20:48:58.402147666+08:00","endsAt":"2020-02-17T20:56:58.402147666+08:00","generatorURL":"http://peng01:9090/graph?g0.expr=100+%2A+%281+-+avg+by%28IP%29+%28irate%28node_cpu_seconds_total%7Bmode%3D%22idle%22%7D%5B2m%5D%29%29%29+%3E+80\u0026g0.tab=1"}]
```
另外,根据上面的输出我们还可以发现,当“解除告警”发出去以后,Prometheus还坚持把“解除告警”发送了好多次,而且时间间隔也为75秒。在实验中我们发现大概发送了十几次后,Prometheus就不再发送了。
## **附录**
alertmanager.go的代码:
```
package main
import (
"time"
"io/ioutil"
"net/http"
"fmt"
)
type MyHandler struct{}
func (mh *MyHandler) ServeHTTP(w http.ResponseWriter, r *http.Request) {
body, err := ioutil.ReadAll(r.Body)
if err != nil {
fmt.Printf("read body err, %v\n", err)
return
}
fmt.Println(time.Now())
fmt.Printf("%s\n\n", string(body))
}
func main() {
http.Handle("/api/v1/alerts", &MyHandler{})
http.ListenAndServe(":19093", nil)
}
```
- (一)快速开始
- 安装Prometheus
- 使用NodeExporter采集数据
- AlertManager进行告警
- Grafana数据可视化
- (二)探索PromQL
- 理解时间序列
- Metrics类型
- 初识PromQL
- PromQL操作符
- PromQL内置函数
- rate和irate
- 常见指标的PromQL
- 主机CPU使用率
- 主机内存使用率
- 主机磁盘使用率
- 主机磁盘IO
- 主机网络IO
- API的响应时间
- (三)Promtheus告警处理
- 自定义告警规则
- 示例-对主机进行监控告警
- 部署AlertManager
- 告警的路由与分组
- 使用Receiver接收告警信息
- 集成邮件系统
- 屏蔽告警通知
- 扩展阅读
- AlertManager的API
- Prometheus发送告警机制
- 实践:接收Prometheus的告警
- 实践:AlertManager
- (四)监控Kubernetes集群
- 部署Prometheus
- Kubernetes下的服务发现
- 监控Kubernetes集群
- 监控Kubelet的运行状态
- 监控Pod的资源(cadvisor)
- 监控K8s主机的资源
- KubeStateMetrics
- K8S及ETCD常见监控指标
- ETCD监控指标
- Kube-apiserver监控指标
- (五)其他
- Prometheus的relabel-config
- Target的Endpoint
- Prometheus的其他配置
- (六)BlackboxExporter
- 安装
- BlackboxExporter的应用场景
- 在Promtheus中使用BlackboxExporter
- 参考