
## **安装AlertManager**
github上给了AlertManager的几种安装方法:`https://github.com/prometheus/alertmanager`。
这里,我们使用二进制进行安装。首先下载二进制文件,这里我们下载最新版本0.20.0(`https://prometheus.io/download/#alertmanager`)
```
$ wget https://github.com/prometheus/alertmanager/releases/download/v0.20.0/alertmanager-0.20.0.linux-amd64.tar.gz
```
同样,我们使用systemd来管理这个服务。我们把解压后的整个`alertmanager-0.20.0.linux-amd64`文件夹移动到`/usr/local/`目录下,并重命名为`alertmanager`
```
$ mv ./alertmanager-0.20.0.linux-amd64 /usr/local/alertmanager
```
然后创建文件/usr/lib/systemd/system/alertmanager.service,内容如下
```
[Unit]
Description=alertmanager
After=network.target
[Service]
Type=simple
ExecStart=/usr/local/alertmanager/alertmanager --config.file /usr/local/alertmanager/alertmanager.yml --storage.path=/var/lib/alertmanager
Restart=on-failure
[Install]
WantedBy=multi-user.target
```
编辑`/usr/local/alertmanager/alertmanager.yml`,内容如下(参考Reference)
```
global:
smtp_smarthost: 'smtp.163.com:25' # 使用163邮箱服务器发邮件
smtp_from: 'pshizh@163.com' # 发件人,填写你的163邮箱
smtp_auth_username: 'pshizh@163.com' # 你的163邮箱,与上面保持一致
smtp_auth_password: 'xxxx' # 你的163邮箱的密码
route:
group_by: ['example']
group_wait: 10s
group_interval: 10s
repeat_interval: 1h
receiver: 'email'
receivers:
- name: 'email'
email_configs:
- to: '527103524@qq.com' # 收件人
```
启动alertmanager
```
$ systemctl daemon-reload && systemctl enable alertmanager
$ systemctl start alertmanager && systemctl status alertmanager
```
## **为Prometheus配置AlertManager与告警规则**
编辑`/usr/local/prometheus/prometheus.yml`文件,在`alerting`区域与`rule_files`区域添加如下的内容,最终prometheus.yml文件内容如下:
```
# my global config
global:
scrape_interval: 15s # Set the scrape interval to every 15 seconds. Default is every 1 minute.
evaluation_interval: 15s # Evaluate rules every 15 seconds. The default is every 1 minute.
# Alertmanager configuration
alerting:
alertmanagers:
- static_configs:
- targets: [ 'localhost:9093' ]
rule_files:
- "/usr/local/prometheus/rule_files/memory_alert.yml"
scrape_configs:
- job_name: 'prometheus'
static_configs:
- targets: ['localhost:9090']
- job_name: 'node_exporter'
static_configs:
- targets: ['localhost:9100']
```
然后创建文件`/usr/local/prometheus/rule_files/memory_alert.yml`,内容如下:
```
groups:
- name: example # 尚不清楚是否需要与alertmanager.yml中的route.groupby的名字保持一致
rules:
- alert: NodeMemoryUsage
expr: (node_memory_MemTotal_bytes - node_memory_MemAvailable_bytes) / node_memory_MemTotal_bytes * 100 > 20
for: 1m
annotations:
summary: "{{$labels.instance}}: High Memory usage detected"
description: "{{$labels.instance}}: Memory usage is above 20% (current value is:{{ $value }})"
```
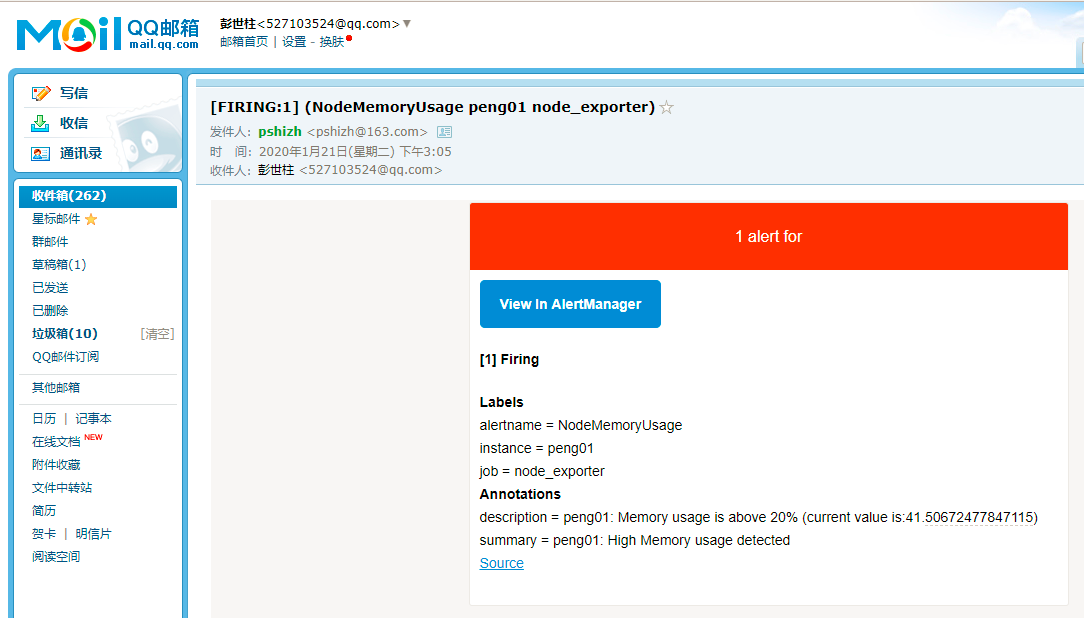
不久后,便可以接收到告警邮件,如下
## **Reference**
[1] https://www.cnblogs.com/longcnblogs/p/9620733.html
[2] https://github.com/prometheus/alertmanager/blob/master/doc/examples/simple.yml
- (一)快速开始
- 安装Prometheus
- 使用NodeExporter采集数据
- AlertManager进行告警
- Grafana数据可视化
- (二)探索PromQL
- 理解时间序列
- Metrics类型
- 初识PromQL
- PromQL操作符
- PromQL内置函数
- rate和irate
- 常见指标的PromQL
- 主机CPU使用率
- 主机内存使用率
- 主机磁盘使用率
- 主机磁盘IO
- 主机网络IO
- API的响应时间
- (三)Promtheus告警处理
- 自定义告警规则
- 示例-对主机进行监控告警
- 部署AlertManager
- 告警的路由与分组
- 使用Receiver接收告警信息
- 集成邮件系统
- 屏蔽告警通知
- 扩展阅读
- AlertManager的API
- Prometheus发送告警机制
- 实践:接收Prometheus的告警
- 实践:AlertManager
- (四)监控Kubernetes集群
- 部署Prometheus
- Kubernetes下的服务发现
- 监控Kubernetes集群
- 监控Kubelet的运行状态
- 监控Pod的资源(cadvisor)
- 监控K8s主机的资源
- KubeStateMetrics
- K8S及ETCD常见监控指标
- ETCD监控指标
- Kube-apiserver监控指标
- (五)其他
- Prometheus的relabel-config
- Target的Endpoint
- Prometheus的其他配置
- (六)BlackboxExporter
- 安装
- BlackboxExporter的应用场景
- 在Promtheus中使用BlackboxExporter
- 参考