
[TOC]
# 简介
Actuator 是 Spring Boot 提供的对应用系统的自省和监控的集成功能,可以查看应用配置的详细信息,例如自动化配置信息、创建的 Spring beans 以及一些环境属性等。
为了保证 actuator 暴露的监控接口的安全性,需要添加安全控制的依赖`spring-boot-start-security`依赖,访问应用监控端点时,都需要输入验证信息。Security 依赖,可以选择不加,不进行安全管理,但不建议这么做
# Actuator 的 REST 接口
Actuator 监控分成两类:原生端点和用户自定义端点;自定义端点主要是指扩展性,用户可以根据自己的实际应用,定义一些比较关心的指标,在运行期进行监控。
原生端点是在应用程序里提供众多 Web 接口,通过它们了解应用程序运行时的内部状况。原生端点又可以分成三类:
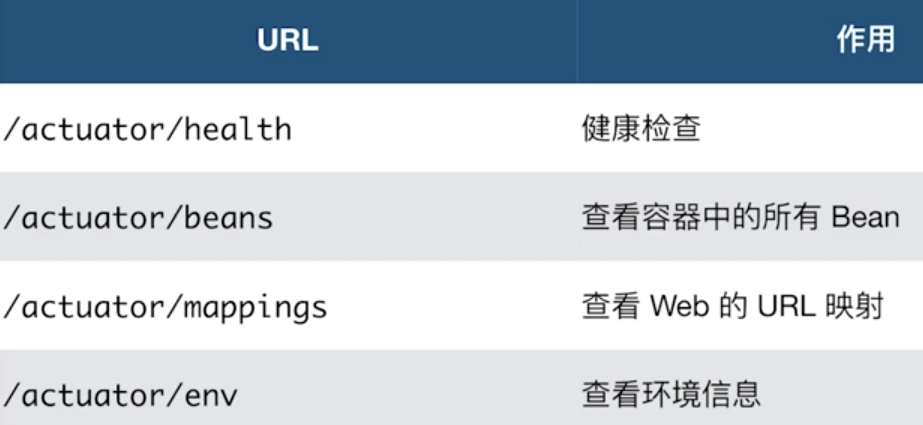
* 应用配置类:可以查看应用在运行期的静态信息:例如自动配置信息、加载的 springbean 信息、yml 文件配置信息、环境信息、请求映射信息;
* 度量指标类:主要是运行期的动态信息,例如堆栈、请求连、一些健康指标、metrics 信息等;
* 操作控制类:主要是指 shutdown,用户可以发送一个请求将应用的监控功能关闭。
Actuator 提供了 13 个接口,具体如下表所示。
| HTTP 方法 | 路径 | 描述 |
| --- | --- | --- |
| GET | /auditevents | 显示应用暴露的审计事件 (比如认证进入、订单失败) |
| GET | /beans | 描述应用程序上下文里全部的 Bean,以及它们的关系 |
| GET | /conditions | 就是 1.0 的 /autoconfig ,提供一份自动配置生效的条件情况,记录哪些自动配置条件通过了,哪些没通过 |
| GET | /configprops | 描述配置属性(包含默认值)如何注入Bean |
| GET | /env | 获取全部环境属性 |
| GET | /env/{name} | 根据名称获取特定的环境属性值 |
| GET | /flyway | 提供一份 Flyway 数据库迁移信息 |
| GET | /liquidbase | 显示Liquibase 数据库迁移的纤细信息 |
| GET | /health | 报告应用程序的健康指标,这些值由 HealthIndicator 的实现类提供 |
| GET | /heapdump | dump 一份应用的 JVM 堆信息 |
| GET | /httptrace | 显示HTTP足迹,最近100个HTTP request/repsponse |
| GET | /info | 获取应用程序的定制信息,这些信息由info打头的属性提供 |
| GET | /logfile | 返回log file中的内容(如果 logging.file 或者 logging.path 被设置) |
| GET | /loggers | 显示和修改配置的loggers |
| GET | /metrics | 报告各种应用程序度量信息,比如内存用量和HTTP请求计数 |
| GET | /metrics/{name} | 报告指定名称的应用程序度量值 |
| GET | /scheduledtasks | 展示应用中的定时任务信息 |
| GET | /sessions | 如果我们使用了 Spring Session 展示应用中的 HTTP sessions 信息 |
| POST | /shutdown | 关闭应用程序,要求endpoints.shutdown.enabled设置为true |
| GET | /mappings | 描述全部的 URI路径,以及它们和控制器(包含Actuator端点)的映射关系 |
| GET | /threaddump | 获取线程活动的快照 |
# 命令详解
在 Spring Boot 2.x 中为了安全期间,Actuator 只开放了两个端点`/actuator/health`和`/actuator/info`。可以在配置文件中设置打开。
可以打开所有的监控点
~~~
management.endpoints.web.exposure.include=*
~~~
yaml中 `'*'`
也可以选择打开部分
~~~
management.endpoints.web.exposure.exclude=beans,trace
~~~
Actuator 默认所有的监控点路径都在`/actuator/*`,当然如果有需要这个路径也支持定制。
~~~
management.endpoints.web.base-path=/manage
~~~
设置完重启后,再次访问地址就会变成`/manage/*`
Actuator 几乎监控了应用涉及的方方面面,我们重点讲述一些经常在项目中常用的命令。
## health
health 主要用来检查应用的运行状态,这是我们使用最高频的一个监控点。通常使用此接口提醒我们应用实例的运行状态,以及应用不”健康“的原因,比如数据库连接、磁盘空间不够等。
默认情况下 health 的状态是开放的,添加依赖后启动项目,访问:`http://localhost:8080/actuator/health`即可看到应用的状态。
~~~
{
"status" : "UP"
}
~~~
默认情况下,最终的 Spring Boot 应用的状态是由 HealthAggregator 汇总而成的,汇总的算法是:
* 1 设置状态码顺序:`setStatusOrder(Status.DOWN, Status.OUT_OF_SERVICE, Status.UP, Status.UNKNOWN);`。
* 2 过滤掉不能识别的状态码。
* 3 如果无任何状态码,整个 Spring Boot 应用的状态是 UNKNOWN。
* 4 将所有收集到的状态码按照 1 中的顺序排序。
* 5 返回有序状态码序列中的第一个状态码,作为整个 Spring Boot 应用的状态。
health 通过合并几个健康指数检查应用的健康情况。Spring Boot Actuator 有几个预定义的健康指标比如`DataSourceHealthIndicator`,`DiskSpaceHealthIndicator`,`MongoHealthIndicator`,`RedisHealthIndicator`等,它使用这些健康指标作为健康检查的一部分。
举个例子,如果你的应用使用 Redis,`RedisHealthindicator`将被当作检查的一部分;如果使用 MongoDB,那么`MongoHealthIndicator`将被当作检查的一部分。
可以在配置文件中关闭特定的健康检查指标,比如关闭 redis 的健康检查:
~~~
management.health.redise.enabled=false
~~~
默认,所有的这些健康指标被当作健康检查的一部分。
## info
info 就是我们自己配置在配置文件中以 info 开头的配置信息,比如我们在示例项目中的配置是:
~~~
info.app.name=spring-boot-actuator
info.app.version= 1.0.0
info.app.test= test
~~~
启动示例项目,访问:`http://localhost:8080/actuator/info`返回部分信息如下:
~~~
{
"app": {
"name": "spring-boot-actuator",
"version": "1.0.0",
"test":"test"
}
}
~~~
## beans
根据示例就可以看出,展示了 bean 的别名、类型、是否单例、类的地址、依赖等信息。
启动示例项目,访问:`http://localhost:8080/actuator/beans`返回部分信息如下:
~~~
[
{
"context": "application:8080:management",
"parent": "application:8080",
"beans": [
{
"bean": "embeddedServletContainerFactory",
"aliases": [
],
"scope": "singleton",
"type": "org.springframework.boot.context.embedded.tomcat.TomcatEmbeddedServletContainerFactory",
"resource": "null",
"dependencies": [
]
},
{
"bean": "endpointWebMvcChildContextConfiguration",
"aliases": [
],
"scope": "singleton",
"type": "org.springframework.boot.actuate.autoconfigure.EndpointWebMvcChildContextConfiguration$$EnhancerBySpringCGLIB$$a4a10f9d",
"resource": "null",
"dependencies": [
]
}
}
]
~~~
## conditions
Spring Boot 的自动配置功能非常便利,但有时候也意味着出问题比较难找出具体的原因。使用 conditions 可以在应用运行时查看代码了某个配置在什么条件下生效,或者某个自动配置为什么没有生效。
启动示例项目,访问:`http://localhost:8080/actuator/conditions`返回部分信息如下:
~~~
{
"positiveMatches": {
"DevToolsDataSourceAutoConfiguration": {
"notMatched": [
{
"condition": "DevToolsDataSourceAutoConfiguration.DevToolsDataSourceCondition",
"message": "DevTools DataSource Condition did not find a single DataSource bean"
}
],
"matched": [ ]
},
"RemoteDevToolsAutoConfiguration": {
"notMatched": [
{
"condition": "OnPropertyCondition",
"message": "@ConditionalOnProperty (spring.devtools.remote.secret) did not find property 'secret'"
}
],
"matched": [
{
"condition": "OnClassCondition",
"message": "@ConditionalOnClass found required classes 'javax.servlet.Filter', 'org.springframework.http.server.ServerHttpRequest'; @ConditionalOnMissingClass did not find unwanted class"
}
]
}
}
}
~~~
## heapdump
返回一个 GZip 压缩的 JVM 堆 dump
启动示例项目,访问:`http://localhost:8080/actuator/heapdump`会自动生成一个 Jvm 的堆文件 heapdump,我们可以使用 JDK 自带的 Jvm 监控工具 VisualVM 打开此文件查看内存快照。
## shutdown
开启接口优雅关闭 Spring Boot 应用,要使用这个功能首先需要在配置文件中开启:
~~~
management.endpoint.shutdown.enabled=true
~~~
配置完成之后,启动示例项目,使用 curl 模拟 post 请求访问 shutdown 接口。
> shutdown 接口默认只支持 post 请求。
~~~
curl -X POST "http://localhost:8080/actuator/shutdown"
{
"message": "Shutting down, bye..."
}
~~~
此时你会发现应用已经被关闭。
## mappings
描述全部的 URI 路径,以及它们和控制器的映射关系
启动示例项目,访问:`http://localhost:8080/actuator/mappings`返回部分信息如下:
~~~
{
"/**/favicon.ico": {
"bean": "faviconHandlerMapping"
},
"{[/hello]}": {
"bean": "requestMappingHandlerMapping",
"method": "public java.lang.String com.neo.controller.HelloController.index()"
},
"{[/error]}": {
"bean": "requestMappingHandlerMapping",
"method": "public org.springframework.http.ResponseEntity<java.util.Map<java.lang.String, java.lang.Object>> org.springframework.boot.autoconfigure.web.BasicErrorController.error(javax.servlet.http.HttpServletRequest)"
}
}
~~~
## threaddump
/threaddump 接口会生成当前线程活动的快照。这个功能非常好,方便我们在日常定位问题的时候查看线程的情况。 主要展示了线程名、线程ID、线程的状态、是否等待锁资源等信息。
启动示例项目,访问:`http://localhost:8080/actuator/threaddump`返回部分信息如下:
~~~
[
{
"threadName": "http-nio-8088-exec-6",
"threadId": 49,
"blockedTime": -1,
"blockedCount": 0,
"waitedTime": -1,
"waitedCount": 2,
"lockName": "java.util.concurrent.locks.AbstractQueuedSynchronizer$ConditionObject@1630a501",
"lockOwnerId": -1,
"lockOwnerName": null,
"inNative": false,
"suspended": false,
"threadState": "WAITING",
"stackTrace": [
{
"methodName": "park",
"fileName": "Unsafe.java",
"lineNumber": -2,
"className": "sun.misc.Unsafe",
"nativeMethod": true
},
...
{
"methodName": "run",
"fileName": "TaskThread.java",
"lineNumber": 61,
"className": "org.apache.tomcat.util.threads.TaskThread$WrappingRunnable",
"nativeMethod": false
}
...
],
"lockInfo": {
"className": "java.util.concurrent.locks.AbstractQueuedSynchronizer$ConditionObject",
"identityHashCode": 372286721
}
}
...
]
~~~
生产出现问题的时候,可以通过应用的线程快照来检测应用正在执行的任务。
- 基础
- 编译和安装
- classpath到底是什么?
- 编译运行
- 安装
- sdkman多版本
- jabba多版本
- java字节码查看
- 数据类型
- 简介
- 整形
- char和int
- 变量和常量
- 大数值运算
- 基本类型包装类
- Math类
- 内存划分
- 位运算符
- 方法相关
- 方法重载
- 可变参数
- 方法引用
- 面向对象
- 定义
- 继承和覆盖
- 接口和抽象类
- 接口定义增强
- 内建函数式接口
- 多态
- 泛型
- final和static
- 内部类
- 包
- 修饰符
- 异常
- 枚举类
- 代码块
- 对象克隆
- BeanUtils
- java基础类
- scanner类
- Random类
- System类
- Runtime类
- Comparable接口
- Comparator接口
- MessageFormat类
- NumberFormat
- 数组相关
- 数组
- Arrays
- string相关
- String
- StringBuffer
- StringBuilder
- 正则
- 日期类
- Locale类
- Date
- DateFormat
- SimpleDateFormat
- Calendar
- 新时间日期API
- 简介
- LocalDate,LocalTime,LocalDateTime
- Instant时间点
- 带时区的日期,时间处理
- 时间间隔
- 日期时间校正器
- TimeUnit
- 用yyyy
- 集合
- 集合和迭代器
- ArrayList集合
- List
- Set
- 判断集合唯一
- Map和Entry
- stack类
- Collections集合工具类
- Stream数据流
- foreach不能修改内部元素
- of方法
- IO
- File类
- 字节流stream
- 字符流Reader
- IO流分类
- 转换流
- 缓冲流
- 流的操作规律
- properties
- 序列化流与反序列化流
- 打印流
- System类对IO支持
- commons-IO
- IO流总结
- NIO
- 异步与非阻塞
- IO通信
- Unix的IO模型
- epoll对于文件描述符操作模式
- 用户空间和内核空间
- NIO与普通IO的主要区别
- Paths,Path,Files
- Buffer
- Channel
- Selector
- Pipe
- Charset
- NIO代码
- 多线程
- 创建线程
- 线程常用方法
- 线程池相关
- 线程池概念
- ThreadPoolExecutor
- Runnable和Callable
- 常用的几种线程池
- 线程安全
- 线程同步的几种方法
- synchronized
- 死锁
- lock接口
- ThreadLoad
- ReentrantLock
- 读写锁
- 锁的相关概念
- volatile
- 释放锁和不释放锁的操作
- 等待唤醒机制
- 线程状态
- 守护线程和普通线程
- Lamda表达式
- 反射相关
- 类加载器
- 反射
- 注解
- junit注解
- 动态代理
- 网络编程相关
- 简介
- UDP
- TCP
- 多线程socket上传图片
- NIO
- JDBC相关
- JDBC
- 预处理
- 批处理
- 事务
- properties配置文件
- DBUtils
- DBCP连接池
- C3P0连接池
- 获得MySQL自动生成的主键
- Optional类
- Jigsaw模块化
- 日志相关
- JDK日志
- log4j
- logback
- xml
- tomcat
- maven
- 简介
- 仓库
- 目录结构
- 常用命令
- 生命周期
- idea配置
- jar包冲突
- 依赖范围
- 私服
- 插件
- git-commit-id-plugin
- maven-assembly-plugin
- maven-resources-plugin
- maven-compiler-plugin
- versions-maven-plugin
- maven-source-plugin
- tomcat-maven-plugin
- 多环境
- 自定义插件
- stream
- swing
- json
- jackson
- optional
- junit
- gradle
- servlet
- 配置
- ServletContext
- 生命周期
- HttpServlet
- request
- response
- 乱码
- session和cookie
- cookie
- session
- jsp
- 简介
- 注释
- 方法,成员变量
- 指令
- 动作标签
- 隐式对象
- EL
- JSTL
- javaBean
- listener监听器
- Filter过滤器
- 图片验证码
- HttpUrlConnection
- 国际化
- 文件上传
- 文件下载
- spring
- 简介
- Bean
- 获取和实例化
- 属性注入
- 自动装配
- 继承和依赖
- 作用域
- 使用外部属性文件
- spel
- 前后置处理器
- 生命周期
- 扫描规则
- 整合多个配置文件
- 注解
- 简介
- 注解分层
- 类注入
- 分层和作用域
- 初始化方法和销毁方法
- 属性
- 泛型注入
- Configuration配置文件
- aop
- aop的实现
- 动态代理实现
- cglib代理实现
- aop名词
- 简介
- aop-xml
- aop-注解
- 代理方式选择
- jdbc
- 简介
- JDBCTemplate
- 事务
- 整合
- junit整合
- hibernate
- 简介
- hibernate.properties
- 实体对象三种状态
- 检索方式
- 简介
- 导航对象图检索
- OID检索
- HQL
- Criteria(QBC)
- Query
- 缓存
- 事务管理
- 关系映射
- 注解
- 优化
- MyBatis
- 简介
- 入门程序
- Mapper动态代理开发
- 原始Dao开发
- Mapper接口开发
- SqlMapConfig.xml
- map映射文件
- 输出返回map
- 输入参数
- pojo包装类
- 多个输入参数
- resultMap
- 动态sql
- 关联
- 一对一
- 一对多
- 多对多
- 整合spring
- CURD
- 占位符和sql拼接以及参数处理
- 缓存
- 延迟加载
- 注解开发
- springMVC
- 简介
- RequestMapping
- 参数绑定
- 常用注解
- 响应
- 文件上传
- 异常处理
- 拦截器
- springBoot
- 配置
- 热更新
- java配置
- springboot配置
- yaml语法
- 运行
- Actuator 监控
- 多环境配置切换
- 日志
- 日志简介
- logback和access
- 日志文件配置属性
- 开机自启
- aop
- 整合
- 整合Redis
- 整合Spring Data JPA
- 基本查询
- 复杂查询
- 多数据源的支持
- Repository分析
- JpaSpecificationExecutor
- 整合Junit
- 整合mybatis
- 常用注解
- 基本操作
- 通用mapper
- 动态sql
- 关联映射
- 使用xml
- spring容器
- 整合druid
- 整合邮件
- 整合fastjson
- 整合swagger
- 整合JDBC
- 整合spingboot-cache
- 请求
- restful
- 拦截器
- 常用注解
- 参数校验
- 自定义filter
- websocket
- 响应
- 异常错误处理
- 文件下载
- 常用注解
- 页面
- Thymeleaf组件
- 基本对象
- 内嵌对象
- 上传文件
- 单元测试
- 模拟请求测试
- 集成测试
- 源码解析
- 自动配置原理
- 启动流程分析
- 源码相关链接
- Servlet,Filter,Listener
- springcloud
- 配置
- 父pom
- 创建子工程
- Eureka
- Hystrix
- Ribbon
- Feign
- Zuul
- kotlin
- 基本数据类型
- 函数
- 区间
- 区块链
- 简介
- linux
- ulimit修改
- 防止syn攻击
- centos7部署bbr
- debain9开启bbr
- mysql
- 隔离性
- sql执行加载顺序
- 7种join
- explain
- 索引失效和优化
- 表连接优化
- orderby的filesort问题
- 慢查询
- show profile
- 全局查询日志
- 死锁解决
- sql
- 主从
- IDEA
- mac快捷键
- 美化界面
- 断点调试
- 重构
- springboot-devtools热部署
- IDEA进行JAR打包
- 导入jar包
- ProjectStructure
- toString添加json模板
- 配置maven
- Lombok插件
- rest client
- 文档显示
- sftp文件同步
- 书签
- 代码查看和搜索
- postfix
- live template
- git
- 文件头注释
- JRebel
- 离线模式
- xRebel
- github
- 连接mysql
- 选项没有Java class的解决方法
- 扩展
- 项目配置和web部署
- 前端开发
- json和Inject language
- idea内存和cpu变高
- 相关设置
- 设计模式
- 单例模式
- 简介
- 责任链
- JUC
- 原子类
- 原子类简介
- 基本类型原子类
- 数组类型原子类
- 引用类型原子类
- JVM
- JVM规范内存解析
- 对象的创建和结构
- 垃圾回收
- 内存分配策略
- 备注
- 虚拟机工具
- 内存模型
- 同步八种操作
- 内存区域大小参数设置
- happens-before
- web service
- tomcat
- HTTPS
- nginx
- 变量
- 运算符
- 模块
- Rewrite规则
- Netty
- netty为什么没用AIO
- 基本组件
- 源码解读
- 简单的socket例子
- 准备netty
- netty服务端启动
- 案例一:发送字符串
- 案例二:发送对象
- websocket
- ActiveMQ
- JMS
- 安装
- 生产者-消费者代码
- 整合springboot
- kafka
- 简介
- 安装
- 图形化界面
- 生产过程分析
- 保存消息分析
- 消费过程分析
- 命令行
- 生产者
- 消费者
- 拦截器interceptor
- partition
- kafka为什么快
- kafka streams
- kafka与flume整合
- RabbitMQ
- AMQP
- 整体架构
- RabbitMQ安装
- rpm方式安装
- 命令行和管控页面
- 消息生产与消费
- 整合springboot
- 依赖和配置
- 简单测试
- 多方测试
- 对象支持
- Topic Exchange模式
- Fanout Exchange订阅
- 消息确认
- java client
- RabbitAdmin和RabbitTemplate
- 两者简介
- RabbitmqAdmin
- RabbitTemplate
- SimpleMessageListenerContainer
- MessageListenerAdapter
- MessageConverter
- 详解
- Jackson2JsonMessageConverter
- ContentTypeDelegatingMessageConverter
- lucene
- 简介
- 入门程序
- luke查看索引
- 分析器
- 索引库维护
- elasticsearch
- 配置
- 插件
- head插件
- ik分词插件
- 常用术语
- Mapping映射
- 数据类型
- 属性方法
- Dynamic Mapping
- Index Template 索引模板
- 管理映射
- 建立映射
- 索引操作
- 单模式下CURD
- mget多个文档
- 批量操作
- 版本控制
- 基本查询
- Filter过滤
- 组合查询
- 分析器
- redis
- String
- list
- hash
- set
- sortedset
- 发布订阅
- 事务
- 连接池
- 管道
- 分布式可重入锁
- 配置文件翻译
- 持久化
- RDB
- AOF
- 总结
- Lettuce
- zookeeper
- zookeeper简介
- 集群部署
- Observer模式
- 核心工作机制
- zk命令行操作
- zk客户端API
- 感知服务动态上下线
- 分布式共享锁
- 原理
- zab协议
- 两阶段提交协议
- 三阶段提交协议
- Paxos协议
- ZAB协议
- hadoop
- 简介
- hadoop安装
- 集群安装
- 单机安装
- linux编译hadoop
- 添加新节点
- 退役旧节点
- 集群间数据拷贝
- 归档
- 快照管理
- 回收站
- 检查hdfs健康状态
- 安全模式
- hdfs简介
- hdfs命令行操作
- 常见问题汇总
- hdfs客户端操作
- mapreduce工作机制
- 案例-单词统计
- 局部聚合Combiner
- combiner流程
- combiner案例
- 自定义排序
- 自定义Bean对象
- 排序的分类
- 案例-按总量排序需求
- 一次性完成统计和排序
- 分区
- 分区简介
- 案例-结果分区
- 多表合并
- reducer端合并
- map端合并(分布式缓存)
- 分组
- groupingComparator
- 案例-求topN
- 全局计数器
- 合并小文件
- 小文件的弊端
- CombineTextInputFormat机制
- 自定义InputFormat
- 自定义outputFormat
- 多job串联
- 倒排索引
- 共同好友
- 串联
- 数据压缩
- InputFormat接口实现类
- yarn简介
- 推测执行算法
- 本地提交到yarn
- 框架运算全流程
- 数据倾斜问题
- mapreduce的优化方案
- HA机制
- 优化
- Hive
- 安装
- shell参数
- 数据类型
- 集合类型
- 数据库
- DDL操作
- 创建表
- 修改表
- 分区表
- 分桶表
- DML操作
- load
- insert
- select
- export,import
- Truncate
- 注意
- 严格模式
- 函数
- 内置运算符
- 内置函数
- 自定义函数
- Transfrom实现
- having和where不同
- 压缩
- 存储
- 存储和压缩结合使用
- explain详解
- 调优
- Fetch抓取
- 本地模式
- 表的优化
- GroupBy
- count(Distinct)去重统计
- 行列过滤
- 动态分区调整
- 数据倾斜
- 并行执行
- JVM重用
- 推测执行
- reduce内存和个数
- sql查询结果作为变量(shell)
- youtube
- flume
- 简介
- 安装
- 常用组件
- 拦截器
- 案例
- 监听端口到控制台
- 采集目录到HDFS
- 采集文件到HDFS
- 多个agent串联
- 日志采集和汇总
- 单flume多channel,sink
- 自定义拦截器
- 高可用配置
- 使用注意
- 监控Ganglia
- sqoop
- 安装
- 常用命令
- 数据导入
- 准备数据
- 导入数据到HDFS
- 导入关系表到HIVE
- 导入表数据子集
- 增量导入
- 数据导出
- 打包脚本
- 作业
- 原理
- azkaban
- 简介
- 安装
- 案例
- 简介
- command类型单一job
- command类型多job工作流flow
- HDFS操作任务
- mapreduce任务
- hive脚本任务
- oozie
- 安装
- hbase
- 简介
- 系统架构
- 物理存储
- 寻址机制
- 读写过程
- 安装
- 命令行
- 基本CURD
- java api
- CURD
- CAS
- 过滤器查询
- 建表高级属性
- 与mapreduce结合
- 与sqoop结合
- 协处理器
- 参数配置优化
- 数据备份和恢复
- 节点管理
- 案例-点击流
- 简介
- HUE
- 安装
- storm
- 简介
- 安装
- 集群启动及任务过程分析
- 单词统计
- 单词统计(接入kafka)
- 并行度和分组
- 启动流程分析
- ACK容错机制
- ACK简介
- BaseRichBolt简单使用
- BaseBasicBolt简单使用
- Ack工作机制
- 本地目录树
- zookeeper目录树
- 通信机制
- 案例
- 日志告警
- 工具
- YAPI
- chrome无法手动拖动安装插件
- 时间和空间复杂度
- jenkins
- 定位cpu 100%
- 常用脚本工具
- OOM问题定位
- scala
- 编译
- 基本语法
- 函数
- 数组常用方法
- 集合
- 并行集合
- 类
- 模式匹配
- 异常
- tuple元祖
- actor并发编程
- 柯里化
- 隐式转换
- 泛型
- 迭代器
- 流stream
- 视图view
- 控制抽象
- 注解
- spark
- 企业架构
- 安装
- api开发
- mycat
- Groovy
- 基础